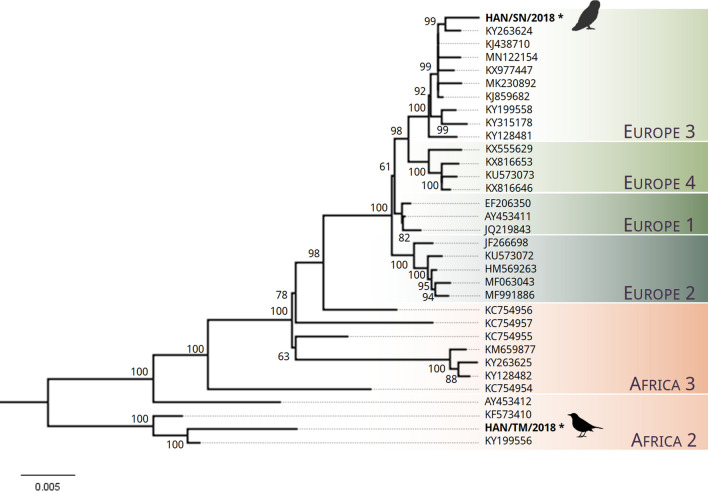
Figure 6.
Maximum likelihood phylogeny of USUV sequences. Phylogenetic tree was constructed using a subset (n = 31) of published USUV sequences from NCBI Genbank representing USUV strains from lineages Africa 2–3 and Europe 1–4. Maximum likelihood phylogeny was performed using nearly complete genomes (> 10,203 bp) with a GTR + G model of nucleotide substitution. The tree was generated using bootstrap support of 1000 replications. Bootstrap values are depicted on the major nodes. The tip labels represent the NCBI Genbank accession numbers of respective strains and the scale bar is proportional to the number of nucleotide substitutions per site. The novel sequences of the strains “HAN/SN/2018” and “HAN/TM/2018” that were generated via NGS in this study are marked with an asterisk and were obtained from a great grey owl and a black bird, respectively. The pictogram of the owl was created with BioRender.com. The pictogram of the blackbird is licensed under CC BY-SA 3.0 (https://creativecommons.org/licenses/by-sa/3.0/legalcode) and originally created by Andreas Plank and can be found under the following link: https://commons.wikimedia.org/wiki/File:Blackbird_Turdus_merula_female_silhouette.svg.

