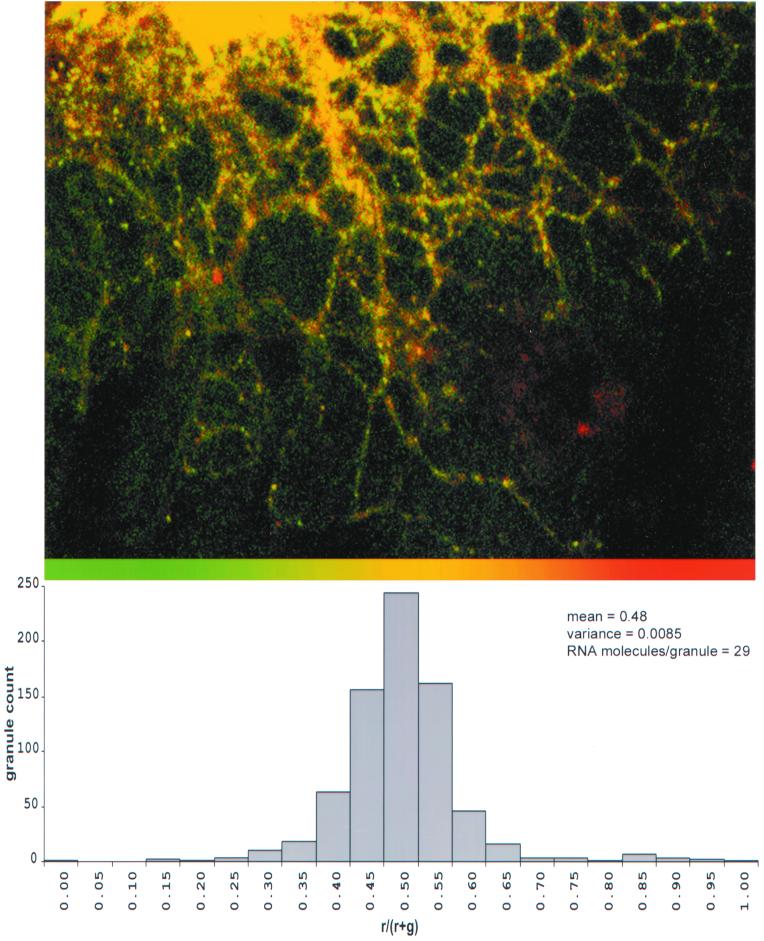
FIG. 5.
Colocalization of HIV-1 gag and vpr RNAs. Oligodendrocytes were coinjected with fluorescein-labeled gag RNA and Texas red-labeled vpr RNA. The distributions of the two RNAs were visualized by dual-channel confocal microscopy. (A) Distribution of gag RNA in the green channel and vpr RNA in the red channel. The overlap of red and green appears yellow. The ratio of gag and vpr RNA in each granule was determined by single granule ratiometric analysis. (B) The distribution of ratios for a population of 748 granules is shown as a histogram. The mean is 0.48, and the variance is 0.0085, from which a sample size of 29 RNA molecules/granule was calculated.

