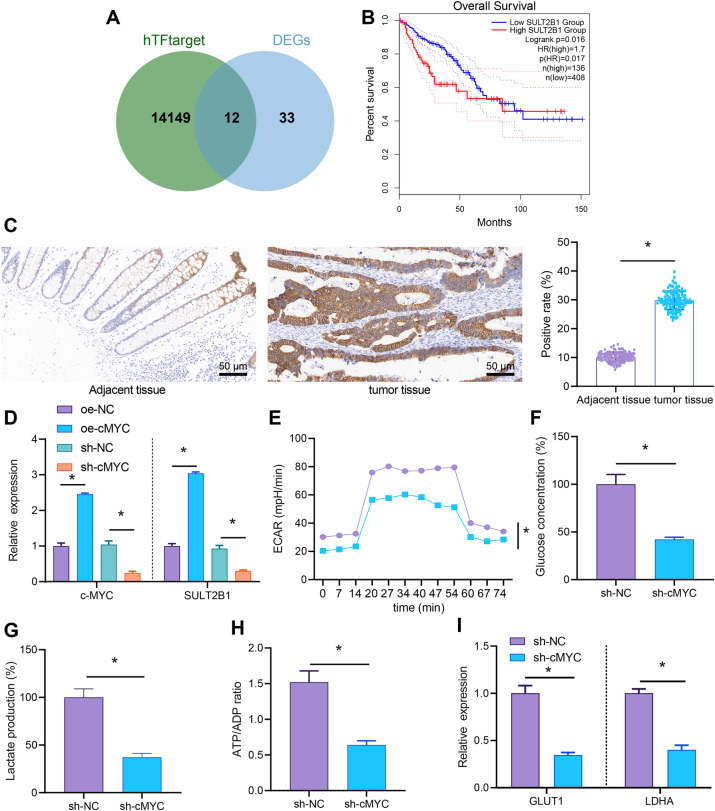
Fig. 4. c-MYC knockdown diminishes SULT2B1 expression and dampened glycolytic metabolism of colon cancer cells.
A The downstream genes of transcription factor c-MYC predicted by hTFtarget and intersected with 45 obviously upregulated genes to obtain 12 genes. B Clinical data of TCGA analyzed by GEPIA to draw the survival curve between SULT2B1 expression and colon cancer. C The protein expression of c-MYC in colon cancer and adjacent normal tissues detected by immunohistochemistry (adjacent tissues: n = 120; tumor tissues: n = 120; ×200). D The mRNA expression of c-MYC and SULT2B1 in colon cancer cells after overexpression and knocking down c-MYC determined by RT-qPCR. E Detection of ECAR in colon cancer cells after knocking down c-MYC. F Detection of glucose content in colon cancer cells after knocking down c-MYC. G Detection of lactate production in colon cancer cells after knocking down c-MYC. H Detection of ATP/ADP in colon cancer cells after knocking down c-MYC. I RT-qPCR to detect the mRNA expression of GLUT1 and LDHA in colon cancer cells after knocking down c-MYC. The cell experiment was repeated three times. *p < 0.05 between two groups.

