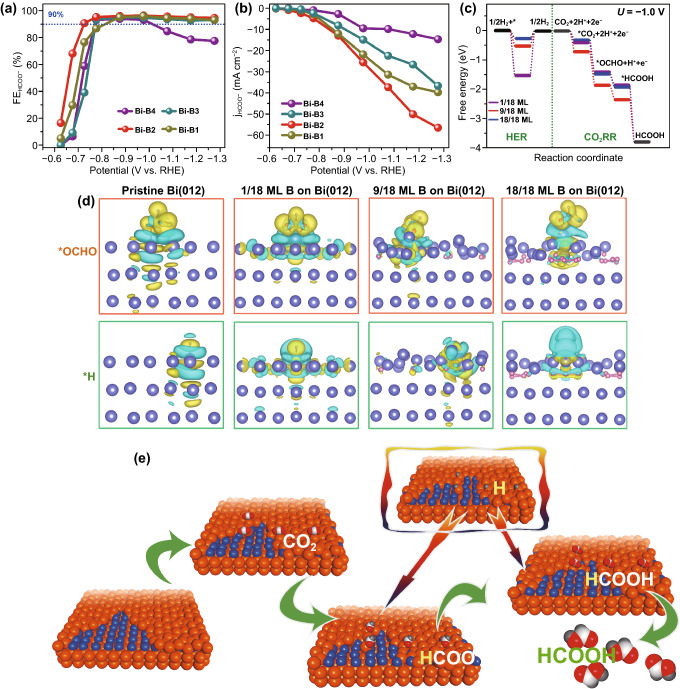
Fig. 5.
a FE and b partial current density for formate generation for Bi-B samples, c free energy diagrams of Bi with different B concentrations at U = –1.0 V and d side view of differential charge densities of *OCHO and *H adsorbed on different surfaces, regions of yellow and cyan denote electron accumulation and depletion, respectively. Blue, pink, brown, red, and pale balls represent Bi, B, C, O, and H atoms, respectively (The value of isosurface is 0.0005 e Å−3). e Schematic illustration for the H+ promoted hydronation process of CO2 to formate on Bi surface with B dopant

