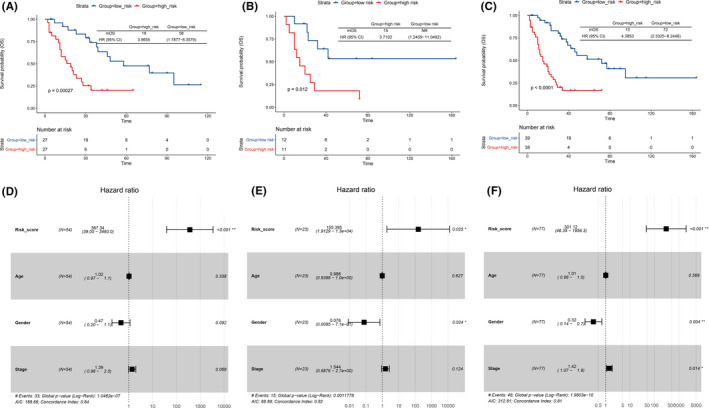
FIGURE 5.

K–M survival and hazard ratio analysis. The Kaplan–Meier curves of overall survival (OS) for SCLC patients with high risk and low risk in training set (A), testing set (B), and all data set (C). Hazard ratios (HRs) and 95% CIs are for high‐risk group versus low‐risk population. p values were calculated with the log‐rank test. Gender (p = 0.024) in testing set (E) and gender (p = 0.004) and stage (p = 0.014) in all data set (p = 0.004) (F) were significantly related to the prognosis by Cox regression analysis
