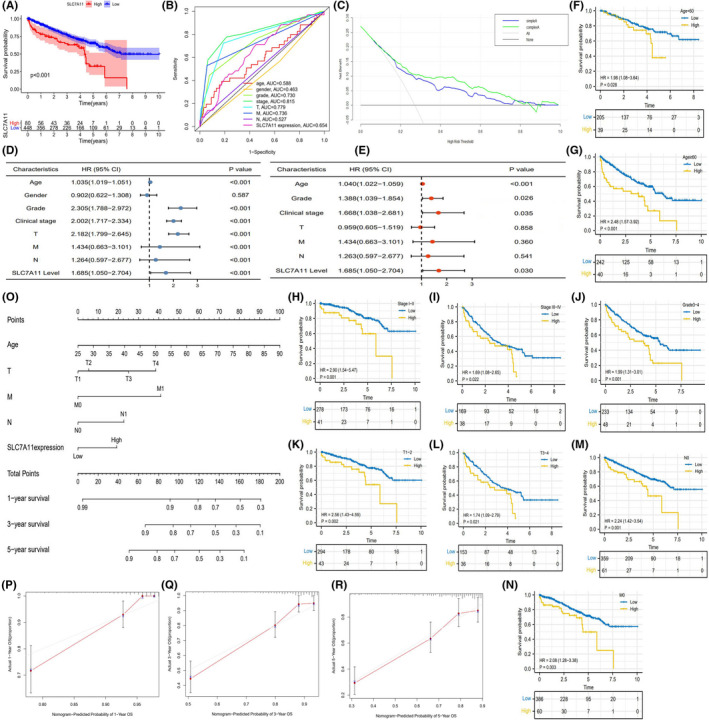
FIGURE 3.

The prognostic value of SLC7A11 in TCGA cohort. (A) The survival difference between high and low SLC7A11 expressions. (B) ROC in TCGA cohort. (C) DCA curve of SLC7A11. Different curves represent two kinds of RCC prognostic models (based on multivariate logistic regression analysis). “Sample A” represents the prognostic model consisting of age, histological grade, and TNM staging. “Complex A” represents the improved prognostic model consisting of age, histological grade, TNM staging, and SLC7A11 expression. (D) Cox univariate regression analysis in TCGA cohort. (E) Cox multivariate regression analysis in TCGA cohort. (F–N) Clinical subgroup analyses. (O) The nomogram consisting of age, TNM staging, and SLC7A11 expression. (P–R) Calibration plots of 1‐, 3‐, and 5‐year OSR. DCA, decision curve analysis; OSR, overall survival rate; RCC, renal cell carcinoma; ROC, receiver operating characteristic curve
