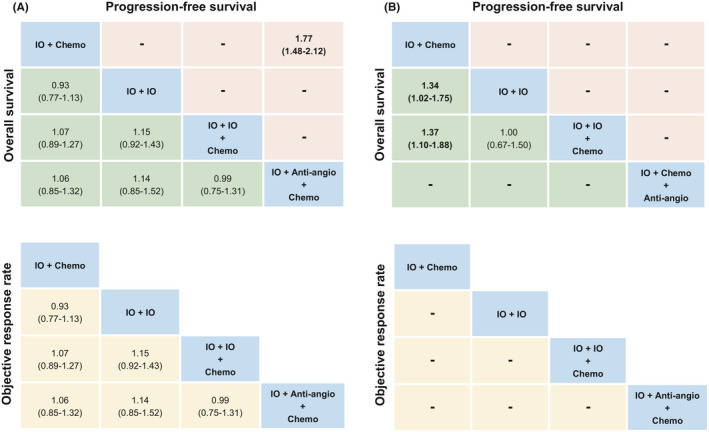
FIGURE 6.

Pooled estimates of the network meta‐analysis according to PD‐L1 expression. (A) Non‐squamous cohort and (B) squamous cohort. Hazard ratios less than 1 and odds ratios more than 1 favor the former treatment. Significant results are in bold. We did not show the analysis for Anti‐angio + Chemo and Chemo. IO + Anti‐angio + Chemo; Immunotherapy + Anti‐angiogenic therapy + Chemotherapy; IO + Chemo; Immunotherapy + Chemotherapy; IO + IO; Immunotherapy + Immunotherapy; IO + IO + Chemo; Immunotherapy + Immunotherapy + Chemotherapy.
