FIGURE 3.

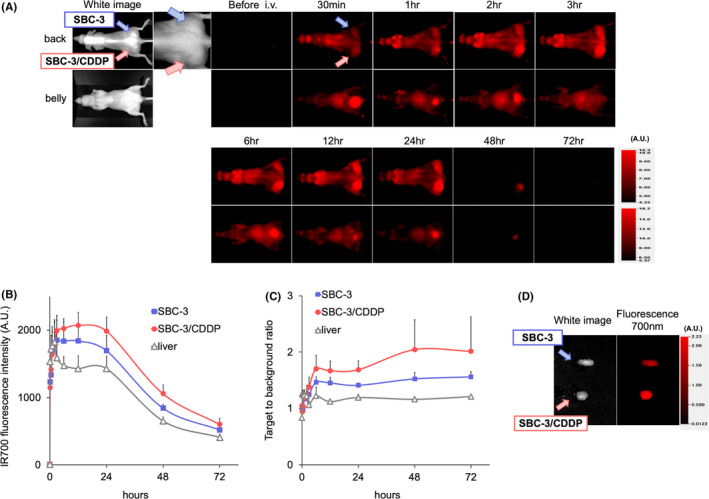
Comparing biodistribution of tra‐IR700 in SBC‐3 and SBC‐3/CDDP tumor‐bearing mice. (A) In vivo 700 nm fluorescence‐imaging (FLI) of the tumor‐bearing mice (right‐side dorsum: SBC‐3 tumor, left‐side dorsum: SBC‐3/CDDP tumor) using tra‐IR700. Both tumors showed high fluorescence signals after intravenous administration of tra‐IR700. The IR700‐fluorescence was higher in SBC‐3/CDDP tumors than in SBC‐3 tumors. (B) Quantification of 700 nm fluorescence intensities in the tumors and liver. Fluorescence intensities tended to be higher in SBC‐3/CDDP tumors than in SBC‐3 tumors at all time points. (data are means ± SEM. n = 3). (C) Target to background ratio (TBR) also tended to be higher in SBC‐3/CDDP tumors than in SBC‐3 tumors (data are means ± SEM. n = 3). (D) Ex vivo white light and FLI of SBC‐3 and SBC‐3/CDDP tumor at 24 h after injection of tra‐IR700. FLI showed higher IR700‐intensity in SBC‐3/CDDP tumors than in SBC‐3 tumors. CDDP, cisplatin
