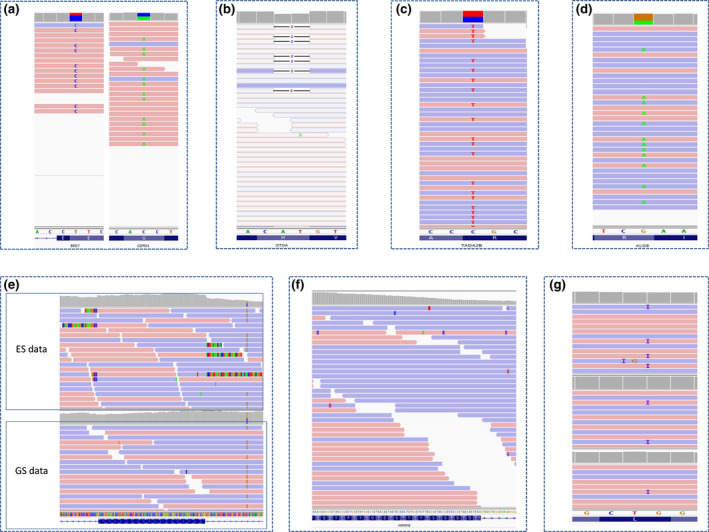
FIGURE 3.

IGV examples of false positive and negative variants. (a) IGV pictures of the BRD7 (left) and GPDP4 (right) strand bias. (b) IGV pictures of the OTOA poor quality mapping. (c and d) IGV pictures of the TADAD2B and ALG8 variants. Note the absence of strand bias. (e) IGV picture of the possible cDNA contamination with misaligned read at the exon‐intron junction in the individual solo‐ES (top) but not in solo‐GS (bottom; two distinct samples from the same individual). (f) IGV picture of the HNRNPAB variant. Note the absence of variant at this position. (g) IGV picture of the SHANK3 variant in the individual (top) and the parental pools (middle and bottom). Note the presence of the variant in both parental pools
