FIGURE 2.

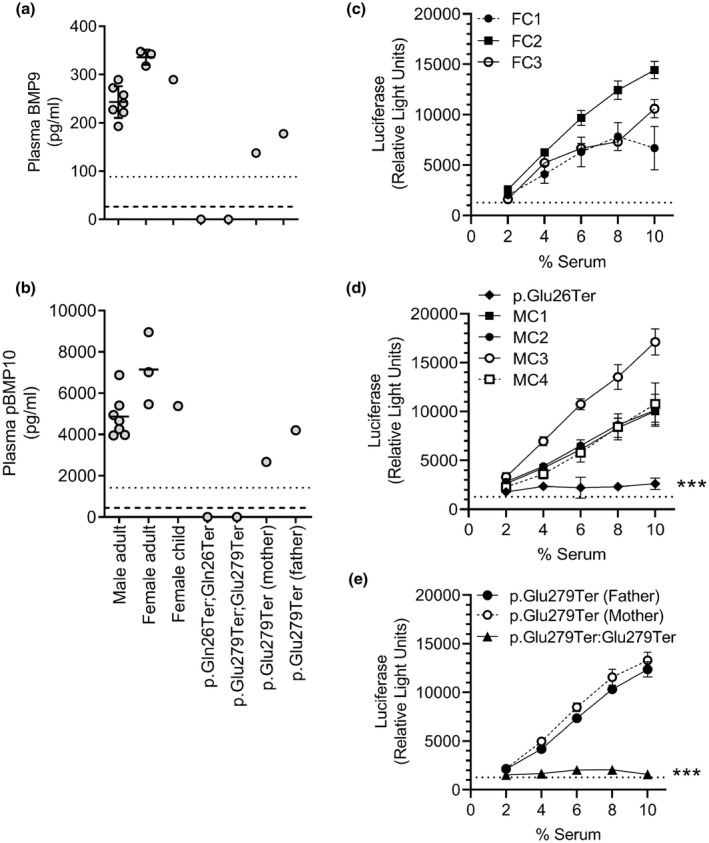
Homozygous GDF2 truncation mutations lead to an absence of circulating BMP9 and pBMP10. (a,b) Levels of (a) BMP9 and (b) pBMP10 in plasma were measured with specific ELISAs. (a) Samples were assayed as 25% EDTA‐plasma, 0.2% goat‐serum, and 0.5% Triton X‐100 in BioRad ELISA buffer. (b) Samples were assayed as BMP9, but with inclusion of 4.5 mM EDTA. All samples were assayed in duplicate, each point represents a different individual. The dotted lines indicate the lower limits of quantification and dashed lines indicate the limits of detection for these assays. (c‐e) Endothelial serum BMP activity, representing BMP9 and BMP10, was assayed in the stable HMEC1‐BRE reporter line. Serum‐starved cells were incubated with 2%‐10% serum for 6 hr and luciferase activity then measured. Samples were measured in duplicate, and the assay was repeated on three separate occasions. Data are presented as mean of the averaged luciferase values for each individual experiment ± SEM. The dotted line indicates the mean SFM response. Individual graphs show: (c) control adult female samples from three separate individuals (FC1‐3), (d) p.[Gln26Ter]:[Gln26Ter] patient sample and control male samples from four separate individuals (MC1‐4), and (e) p.[Glu279Ter]:[Glu279Ter] patient sample and samples from unaffected p.[Glu279Ter] heterozygous parents. Data from all individuals were compared by a multiple comparisons two‐way ANOVA using GraphPad Prism 9. p < 0.001 is relative to all individual controls
