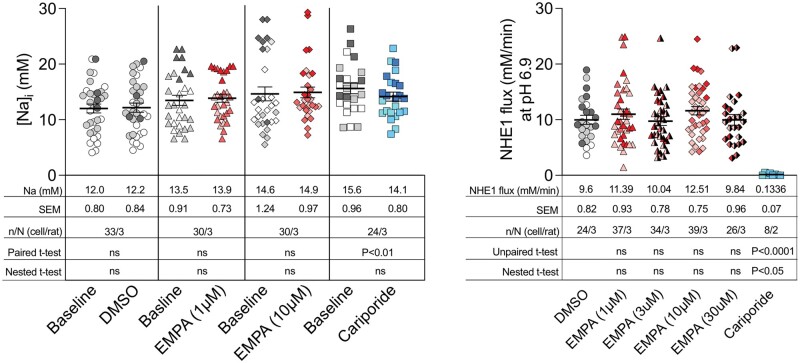
Figure 1.
Intracellular Na measurements and NHE1 flux at pH 6.9 estimated from our original data (Chung et al.). Left panel: Using the calibration described by Zuurbier et al. the SBFI ratiometric values were converted into intracellular Na ([Na+]i). Right panel: NHE1 flux was measured at pH 6.9. In both panels, each data point represents a single observation and these are colour-coded to identify individual cell isolations. The mean values are shown in the inset tables. Using hierarchical analysis, the intraclass correlation coefficient of the [Na+]i and NHE1 flux data were 32% and 3.2%, respectively—demonstrating the need to use hierarchical statistical test on these type of data. When tested with hierarchical (nested) t-tests, EMPA has no effect on [Na+]i or NHE1 flux as previously reported. Cariporide very significantly reduced NHE1 flux whether tested by unpaired t-test or by hierarchical analysis. A paired t-test (but not nested hierarchical analysis) detects a small but significant (likely erroneous) reduction in [Na+]i by cariporide. ns, not significant. Note: We have undertaken the retrospective Na calibration to match that of Zuurbier et al., however, we recognize that this is unlikely to be reliable.

