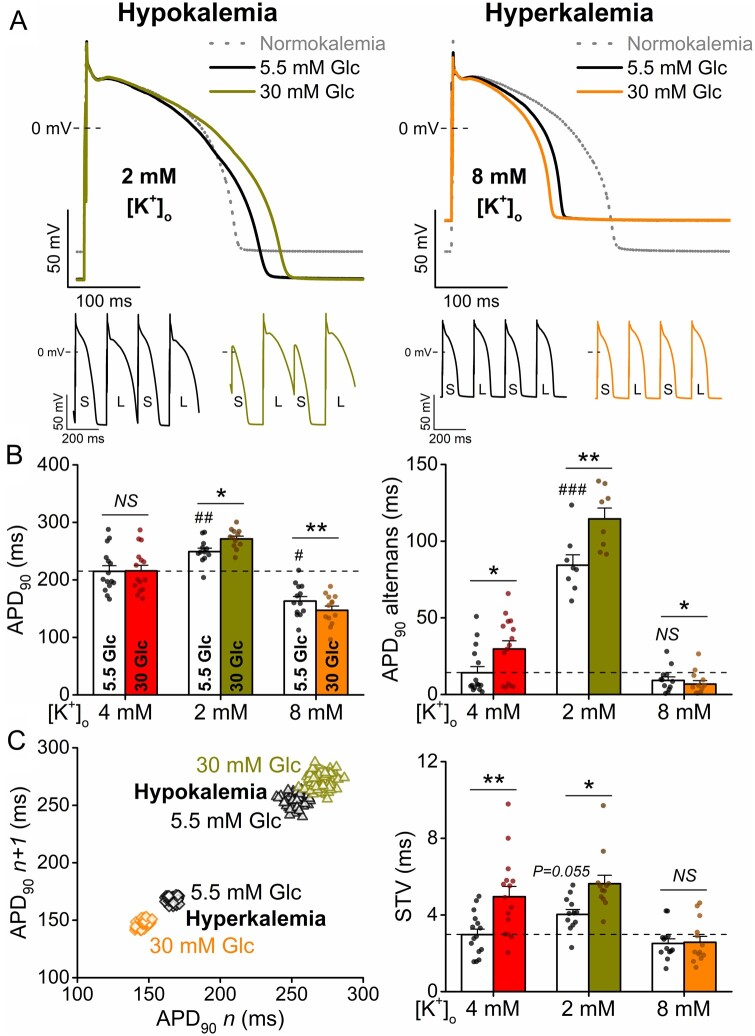
Figure 4.
Hyperglycaemia-induced arrhythmogenic action potentials are dependent on serum K+ levels. (A) High glucose (30 mM, 6 min) induced action potential (AP) changes in hypokalaemia and hyperkalaemia (2 and 8 mM extracellular K+ concentrations, respectively). Representative traces are shown at 1 Hz steady-state, and insets show tachypacing-induced alternans (S and L refer to short and long AP durations, respectively). (B) AP duration at 90% repolarization (APD90) at 1 Hz pacing and the magnitude of the tachypacing-induced APD90 alternans at 5 Hz pacing. (C) Representative Poincaré plots of 50 consecutive APD90 values. Statistics on short-term variability (STV) of APD90 at 1 Hz pacing. (At 1 Hz pacing, normokalaemia: n = 15 cells from seven animals; hypokalaemia: n = 12 cells from five animals; hyperkalaemia: n = 13 cells from four animals. At 5 Hz pacing, normokalaemia: n = 15 cells from seven animals; hypokalaemia: n = 8 cells from five animals; hyperkalaemia: n = 12 cells from four animals.) Nested t-test; NS, non-significant; *P < 0.05, **P < 0.01 vs. 5.5 mM glucose. Nested ANOVA; #P < 0.05, ##P < 0.01, ###P < 0.001 vs. control.

