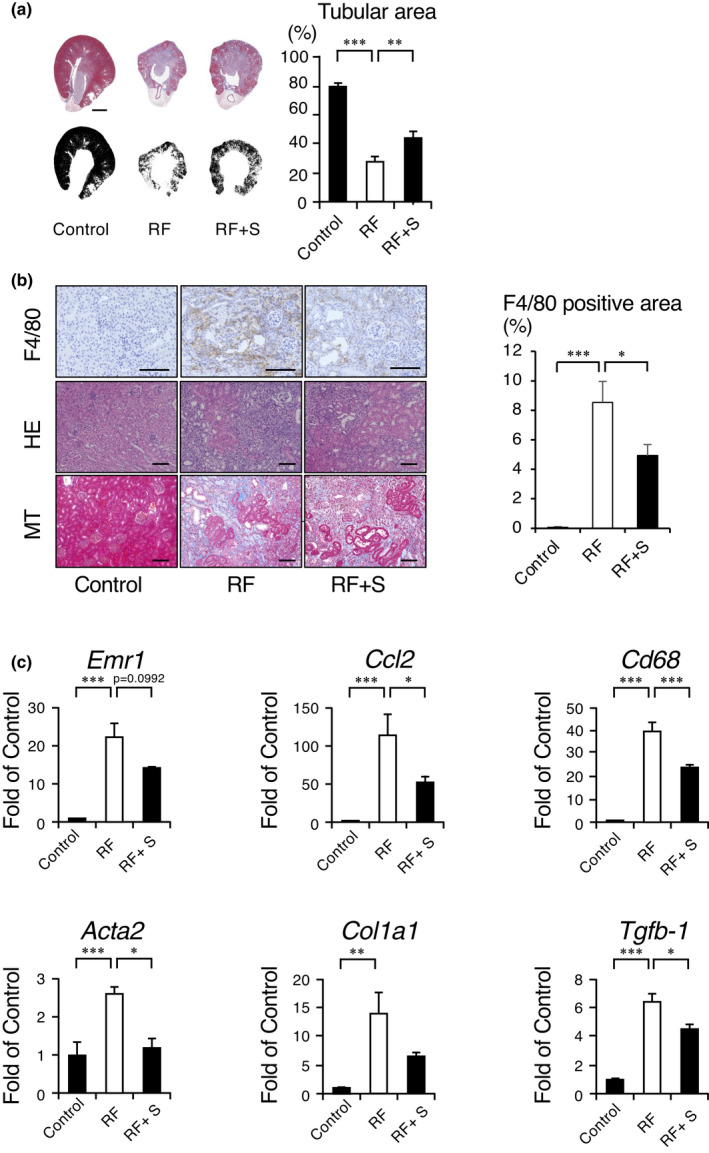
FIGURE 3.

Histological examination of the adenine‐induced renal failure mouse kidney. (a) Masson's trichrome (MT) staining was performed. Morphometric analysis of the cortical tubular area was calculated based on the images. Bars = 500 μm. Data were mean ± SEM. Statistical analysis was performed using a Dunnett's test. *p < 0.05 and ***p < 0.01 were treated as statistically significant. (b) Representative histological images of the adenine‐induced renal failure mouse kidney. Masson's trichrome stained (MTS) and immunohistochemical analysis of F4/80 was also performed. Bars = 50 μm. Arrow indicates the F4/80‐positive macrophages. (c) Quantitative analysis of fibrotic and inflammatory genes. The mRNA levels of emr1, ccl2, cd68, act2, col1a1, and tfb‐1 were measured by real‐time PCR. The mRNA expression levels were normalized with β‐actin. Data were mean ± SEM. Statistical analysis was performed using a Dunnett's test. *p < 0.05 and ***p < 0.01 were treated as statistically significant
