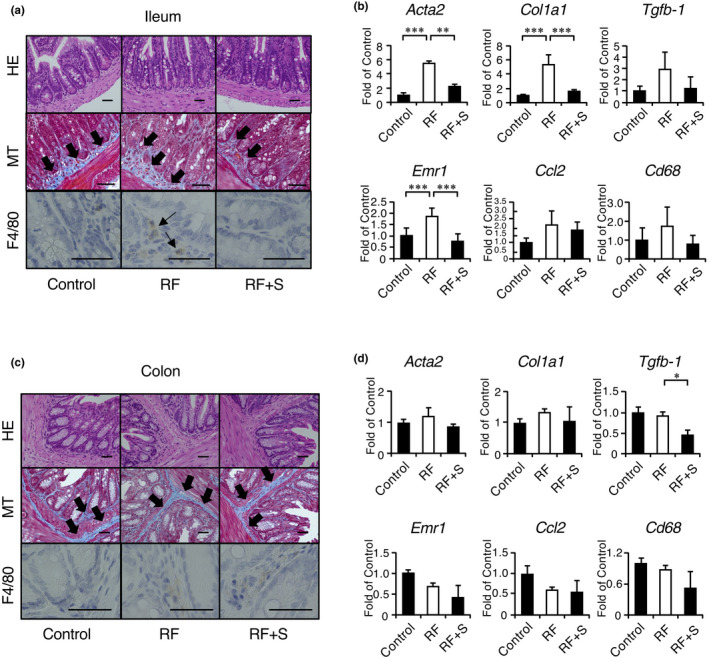
FIGURE 4.

SGL5213 ameliorated intestinal fibrosis and inflammation in the adenine‐induced renal failure model. (a) Representative histological images of the adenine‐induced renal failure mouse ileum. Masson's trichrome (MT) staining was performed. In the MT, the arrow indicates the fibrotic area. In the MTS, the arrow indicates dense eosinophilic granules. Bars = 50 μm. Immunohistochemical analysis of F4/80 was also performed. Arrow indicates the F4/80‐positive macrophages. (b) Quantitative analysis of fibrotic and inflammatory genes in the ileum. The mRNA levels of fibrotic genes (act2, col1, and tgfb1) and inflammatory genes (emr1, ccl2, and cd68) were measured by real‐time PCR. The mRNA expression levels were normalized to that of GAPDH. Data were mean ± SEM. Statistical analyses were performed using a Dunnett's test. *p < 0.05 and ***p < 0.01 were treated as statistically significant. (c) Representative histological images of adenine‐induced renal failure in the mouse colon. SR staining was performed. Bars = 50 μm. Immunohistochemical analysis of F4/80 and claudin 1 was also performed. (d) Quantitative analysis of fibrotic and inflammatory genes in the colon. The mRNA levels of fibrotic genes (act2, col1, and tgfb1) and inflammatory genes (emr1, ccl2, and cd68) were measured by real‐time PCR. The mRNA expression levels were normalized to that of GAPDH. Data were mean ±SEM. Statistical analyses were performed using a Dunnett's test. *p < 0.05 and ***p < 0.01 were treated as statistically significant
