FIGURE 5.

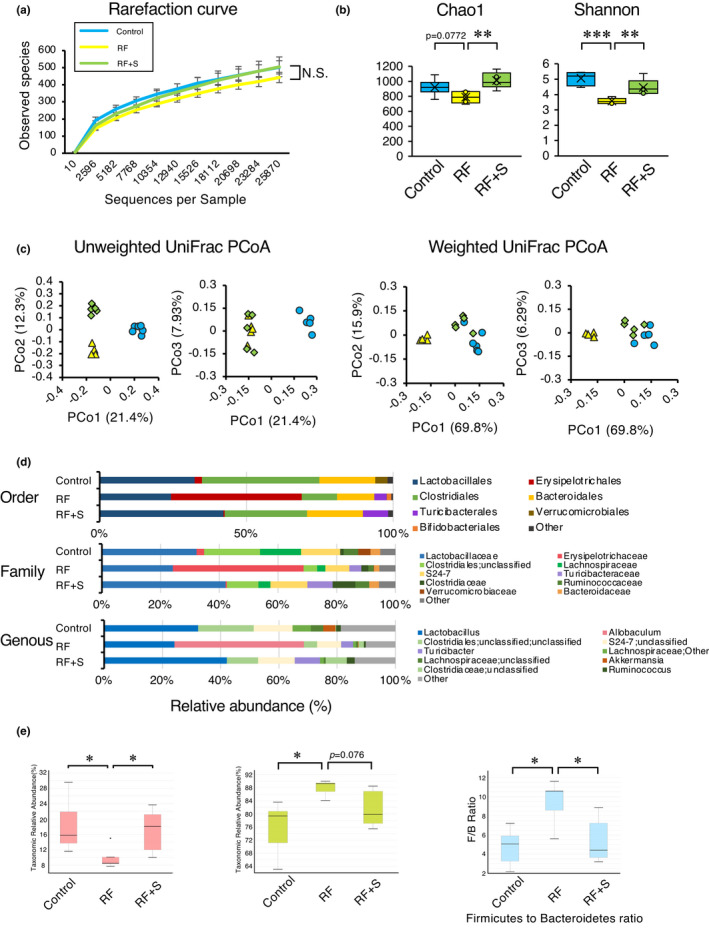
Effect of SGL5213 on the gut‐derived uremic toxins and microbiome community in renal failure mice. (a) Observed OTU rarefaction analysis. OTU rarefaction curves of gut microbiota were used to estimate richness in the control (Cont), renal failure (RF), and RF + SGL5213 groups (10 mg/kg/day). (b) OTU‐based α‐diversity of each microbiome. Significant diversity was seen between control versus RF and RF versus RF + SGL5213 by Chao 1 (left) and Shannon (right) analyses. (c) Principal coordinates analysis of the microbiome profiles using weighted UniFrac. The scores for the first principal component (PC1) versus the second principal component (PC2) and PC1 versus the third principal component (PC3) are presented. (d) Relative abundance of microbiota based on the average abundance of each subgroup at order, family, and genus levels. Major subgroups are indicated on the right. Genera displaying a significant change among the three groups. The y‐axis indicates the abundance of each microbe (%). Control (n = 8), RF (n = 6), RF + SGL5213 (n = 8), and RF + SGL5213 (n = 9) in each group. Data were mean ± SEM. (e) The Firmicutes/Bacteroidetes ratio (F/B ratio) was calculated as a biomarker of gut dysbiosis. A decrease of Bacteroidetes along with an increase of Firmicutes resulted in a dysbiosis signature of gut microbiota in the renal failure. SGL5213 significantly rebalanced the F/B ratio. Statistical analyses were performed using a Dunnett's test. *p < 0.05 was treated as statistically significant
