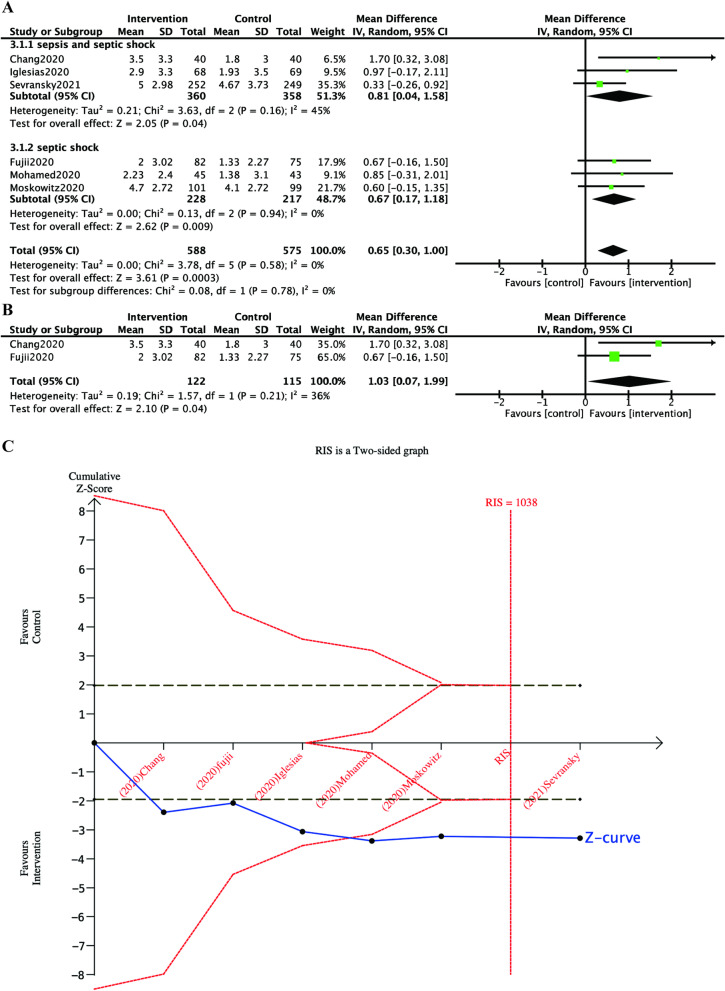
Fig. 4.
Subgroup analysis, sensitivity analysis and TSA of the primary outcome. Legends: a Forest plots of the subgroup analysis for the change in SOFA score over the first 72 h. Septic shock was assessed as a subgroup. b Forest plots of the sensitivity analysis for the change in SOFA score over the first 72 h. Trials that excluded patients with renal failure at enrollment was assessed. c Trial sequential analysis for the change in SOFA score over the first 72 h. The blue cumulative z curve crossed the conventional monitoring boundary and the red trial sequential boundary for benefit (the pooled effect, 0.56; 95% CI 0.23–0.89; I2 = 0%). The required information size (RIS) was 1038 (a two-sided a of 0.05, β of 80%)

