Fig. 5.
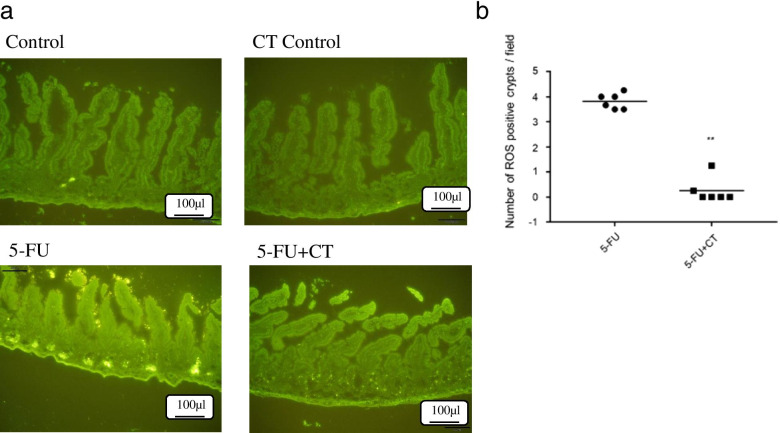
CT suppressed 5-FU induced ROS production in the small intestine. a Fluorescence histochemical study of ROS in intestinal mucosa using ROS-specific fluorescent probe. Control, receiving saline (the vehicle for 5-FU) and methyl cellulose (the vehicle for CT). CT Control, receiving saline (the vehicle for 5-FU) and CT (280 mg/kg). 5-FU, receiving 5-FU (150 mg/kg) and methyl cellulose (the vehicle for CT). 5-FU + CT, receiving 5-FU (150 mg/kg) and CT (280 mg/kg). b Combined data from three experiments showing the numbers of ROS-positive crypts. The numbers of positive crypts in the intestine were counted using a fluorescence microscope. After counting the ROS-positive crypts in 3 visual fields per mouse, the count number (0) in the control group was subtracted and the average value was used as the number for each mouse. ROS-positive crypts were counted in 3 visual fields per mouse and the mean was adopted as data of individual mice. Each data point represents an individual mouse and bars represent the mean. ** p < 0.01 5-FU vs 5-FU + CT by Mann Whitney test

