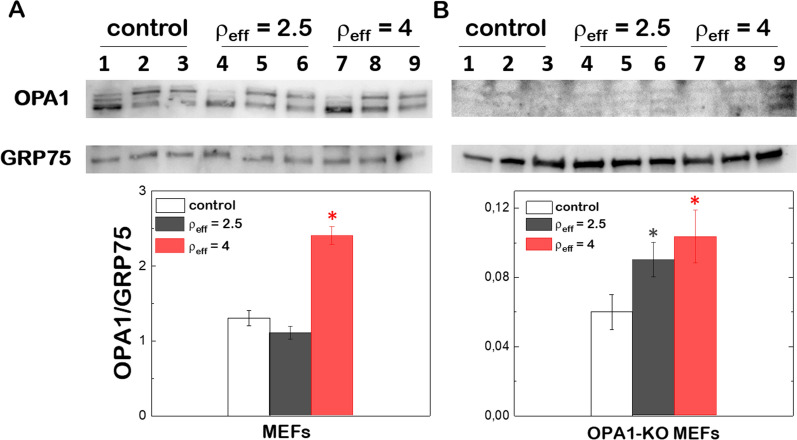
Fig. 4.
Western blot analysis of Opa1 and GRP75 protein levels in MEFs wt (A) and OPA1-KO MEFs (B) after transfection with (C16Im)2(C4O)/DOPE/DSPE-PEG/OPA1 lipoplexes at ρeff = 2.5 and 4 at different time intervals. The relative ratios of band intensity between Opa1 and GRP75 (lower panels) were quantified by ImageJ. Student’s t-test was performed to measure the significance of statistical difference between the different groups and the control (in the absence of treatment) from 3 independent experiments. (*p < 0.05 was considered statistically significant)

