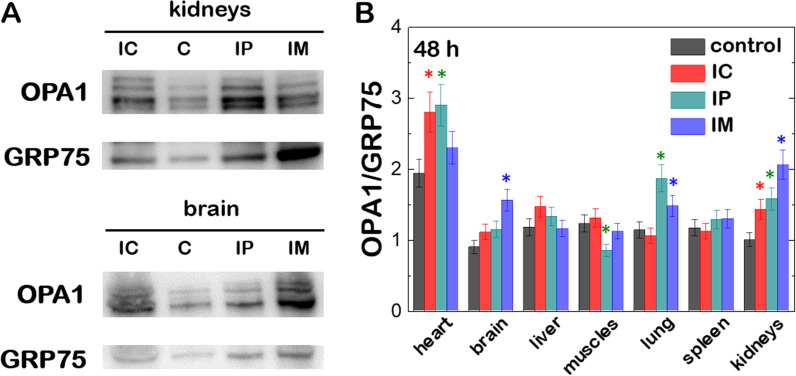
Fig. 6.
A Western blot of Opa1 and GRP75 protein levels in kidneys and brain from CD-1 mice after 48 h of transfection with (C16Im)2(C4O)/DOPE/DSPE-PEG/OPA1 lipoplexes (ρeff = 4). Different lanes correspond to the groups without treatment (C) and with treatment via intraperitoneal (IP), intracardiac (IC) and intramuscular (IM) administration. B Relative ratios of band intensity between Opa1 and GRP75 from different organs of CD-1 mice treated with (C16Im)2(C4O)/DOPE/DSPE-PEG/OPA1 lipoplexes (ρeff = 4) via intraperitoneal (IP), intracardiac (IC) and intramuscular (IM) administration. Results shown are mean ± s.e.m. from 3 independent experiments. The statistical significance was determined using a Student’s t-test between the different groups and the negative control (in the absence of treatment); (*p < 0.05 was considered statistically significant)

