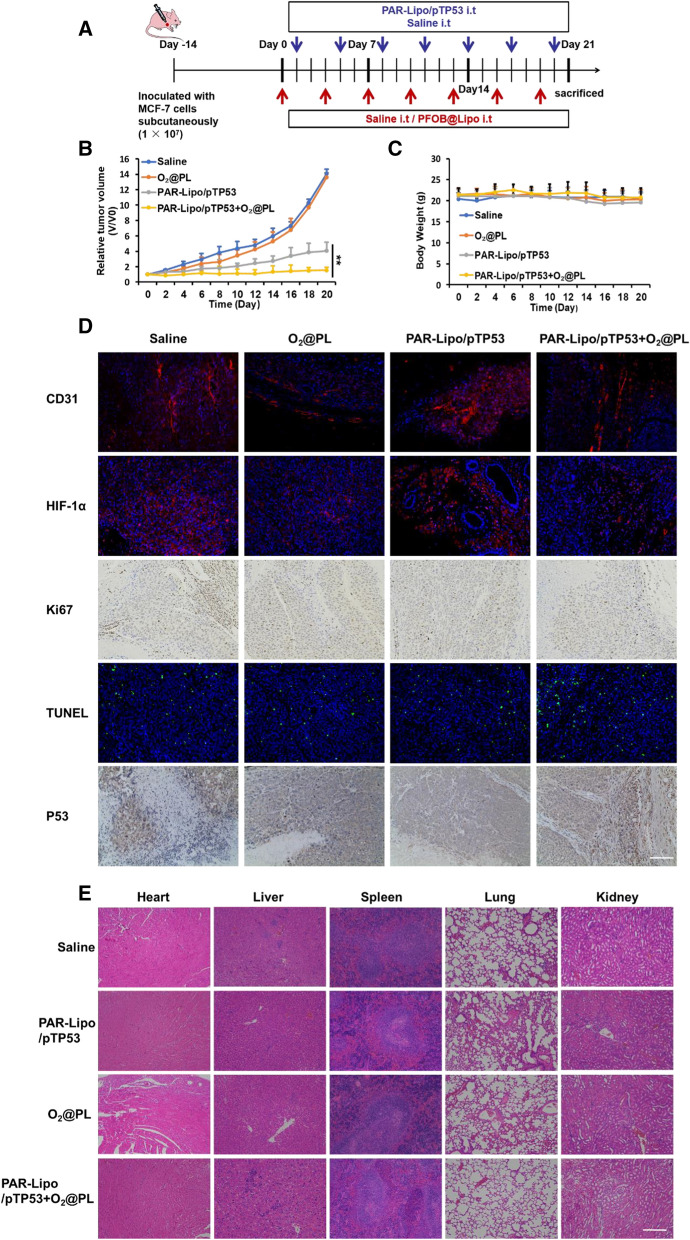
Fig. 6.
Synergistic anti-tumor effect of O2@PL and PAR-Lipo/pTP53 on MCF-7 tumors. A Schematic diagram of administration method for mice bearing MCF-7 tumors (n = 6). The relative tumor volume (B) and body weight (C) of mice in different groups. (*P ≤ 0.05; **P ≤ 0.01). D Immunofluorescence of CD31 (red), HIF-1α (red) and TUNEL (green), and immunohistochemistry of Ki67 and P53 in tumors. Scale bars, 200 μm. E H&E staining of heart, liver, spleen, lung and kidney from mice of the four groups. Scale bars, 200 μm. All error bars are expressed as ± SD, n = 6

