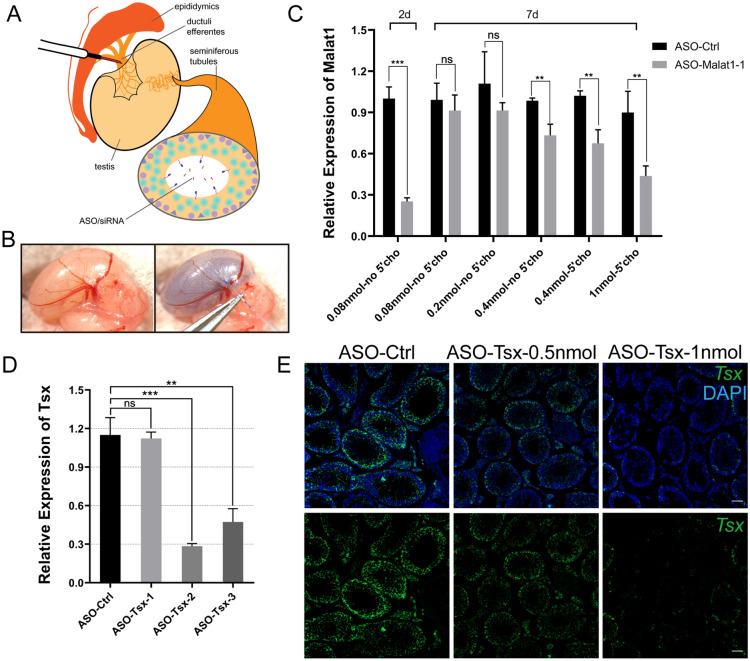
Fig. 1.
Knockdown efficiency of ASOs in testis. A Schematic diagram of microinjection process through seminiferous tubules. B Photos of testis from 3-week-old mouse taken before (left) and after (right) injection. Filling of seminiferous tubules was monitored with the help of Trypan blue. C Relative expression of Malat1 detected by RT-PCR after injecting different doses of ASO-Malat1-1 into mouse testis. Testes were collected 2 or 7 days after injection. Values are expressed as mean ± SD. Statistical significance was determined using t tests. **p < 0.01 and ***p < 0.001. n = 3. D Relative expression of Tsx in testis measured by RT-PCR 2 days after injection of three different ASOs. Values are expressed as mean ± SD. Statistical significance was determined using t tests. **p < 0.01 and ***p < 0.001. n = 3. E Tsx RNA (green) detected by FISH in testes injected by different doses of ASO-Tsx-2. Scale bar, 50 μm

