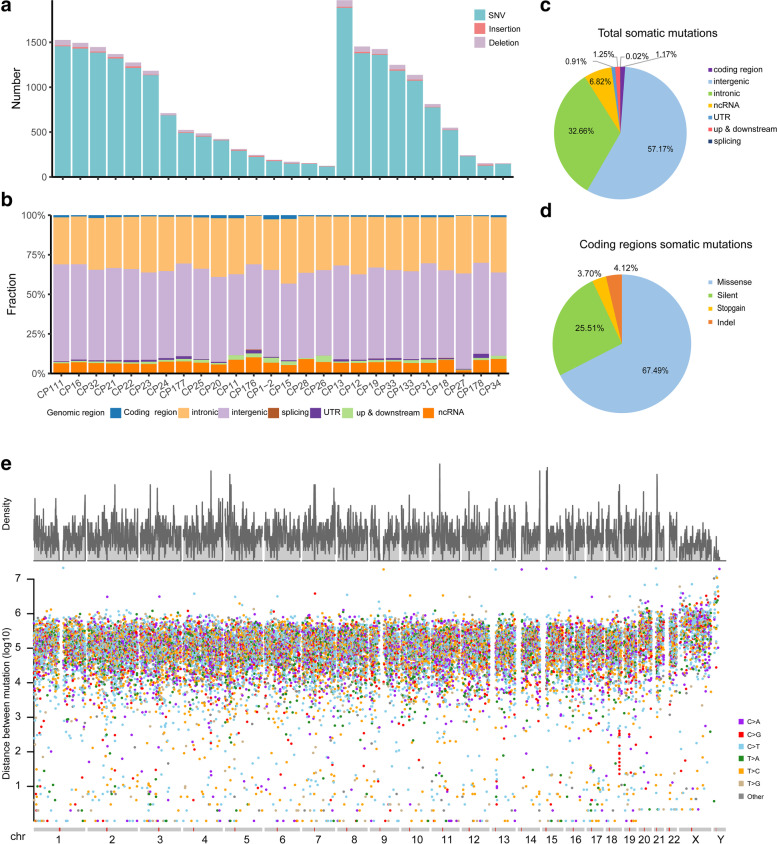
Fig. 1.
Summary of somatic alterations in craniopharyngioma samples. (a) The total number of somatic SNVs/InDels identified in each CP, (b) proportion of somatic SNVs/InDels located in different genomic regions for each CP, (c) proportion of different regions of all somatic SNVs/InDels, (d) proportion of different types in coding regions. (e) The rainfall plots of all somatic mutations (SNVs and InDels) of 26 CPs, the x axis shows the chromosomes of human genome, the y axis represents the density of mutation in one position (up) and the genomic distance (in log scale) of each mutation from the previous mutation (bottom)

