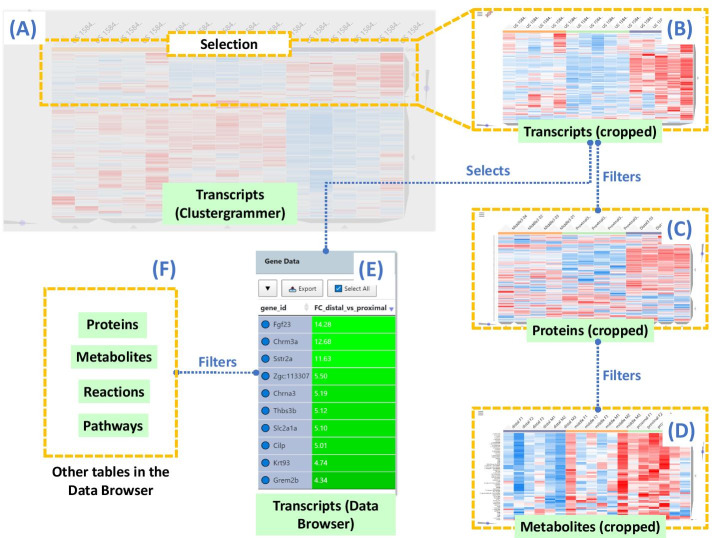
Fig. 5.
Clustergrammer integration in GraphOmics. (a) Clustergrammer displays a hierarchically-clustered interactive heatmap, where clusters can be selected at any level of the dendrogram. For example, here we show an example Clustergrammer component for the Zebrafish transcriptomics data. (b) Selecting a cluster in the Clustergrammer will display a cropped view of that data. For example, here we show an example cropped Clustergrammer showing only transcripts in the currently selected cluster. (c, d) Entities in related Clustergrammers are also filtered according to their relationships to the selected entities. (e) Entities in the selected cluster are also selected in the corresponding Data Browser table. (f) This in turn will filter other related tables in the Data Browser. The selection process can also be performed in reverse such that selecting entities in the Data Browser also filters the linked Clustergrammers (going backward from E to A in the diagram)

