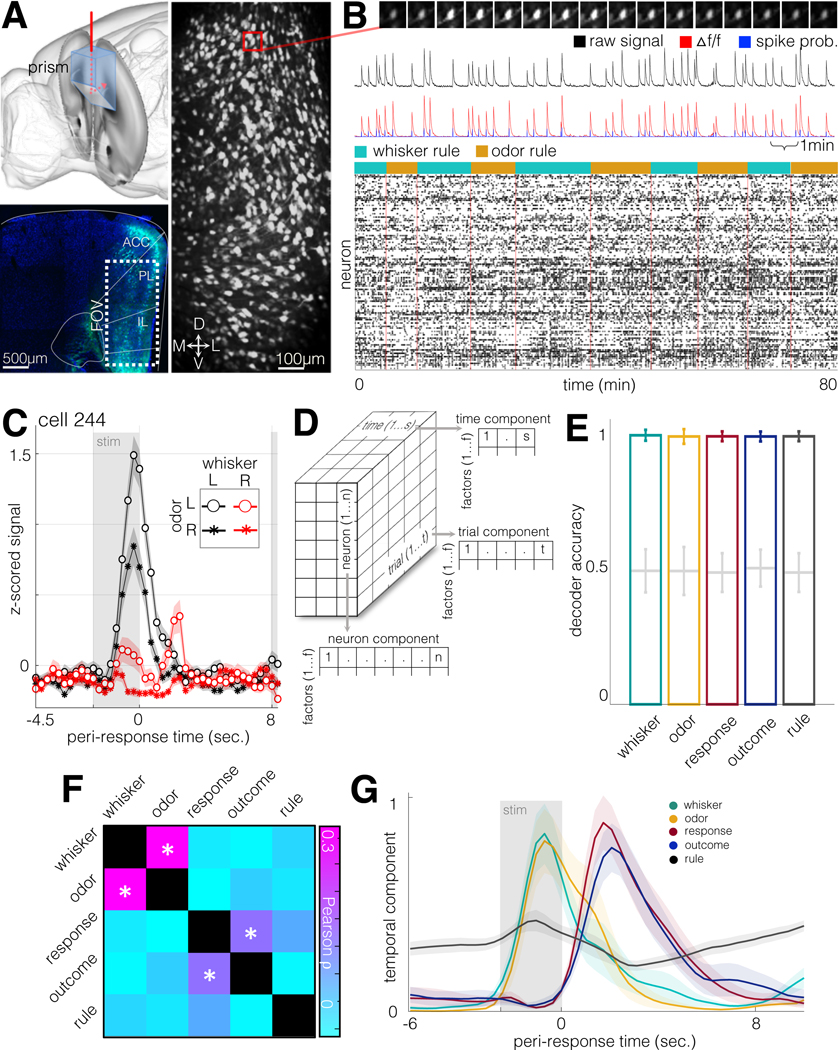
Figure 2. Prefrontal representation of task variables in population activity.
A. Top left: schematic of coronal prism implantation field. FOV bregma coordinates: AP +1.85mm, ML 0–0.75mm left, DV 1.0mm-2.5mm from brain surface. Bottom left: hSyn-GCaMP6f fluorescence in fixed tissue (DAPI in blue). Right: standard deviation image from 115-minute hSyn-GCaMP6f recording (2.89Hz, N = 953 units).
B. Example frames, traces, and putative spike times from calcium imaging sessions. Top: 16 frames of a calcium transient from an example neuron in (A). Frames downsampled by a factor of 2. N=100 units recorded over the course of 10 trial blocks.
C. Mean ± SEM of z-scored activity for all trials from an example neuron during trials with four stimulus combinations (whisker stimulus 35Hz/155Hz, odor stimulus olive/sesame). Stimulus is presented from −2.5s to 0s. Earliest subsequent trial onset at 8 sec.
D. Schematic of TCA rank decomposition.
E. SVM decoder accuracy for five task-related features. Trial factors obtained from TCA decomposition (35 factors) were used as inputs to a support vector machine-based decoder. N=4740 neurons from 21 animals. Error bars, standard deviations. Gray plots, shuffled labels.
F. Cross-correlation of task feature representation in TCA trial space. GLM regression was performed on the five task variables, using TCA factors as predictors. Pearson correlation was then performed on the resulting coefficients (same data as in E). Asterisks indicate p<0.01.
G. Time components from significantly modulated factors. For each of the five task variables, factors most strongly modulated by each task variable are shown in the temporal domain (mean ± SEM for each variable, N=16 factors for whisker stimulus, N=12 factors for odor stimulus, N=26 factors for response direction, N=21 factors for trial outcome, N=59 factors for rule).

