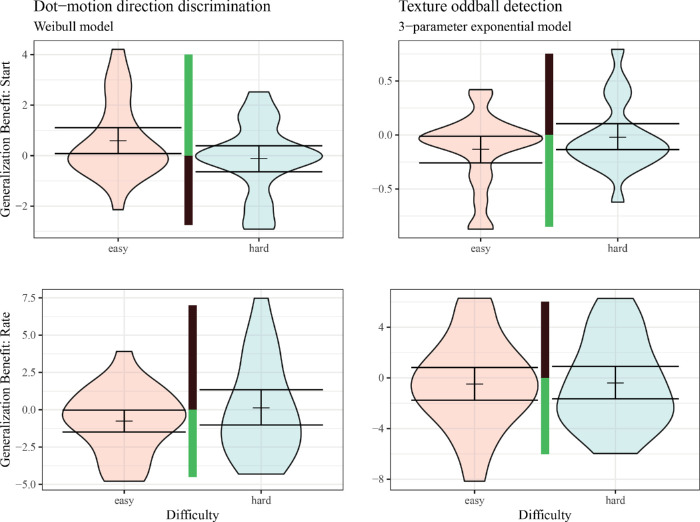
Figure 7.
Differences between generalization parameters and training parameters. The most frequently best-fitting model was used for each task. Central guide bars show, in green, the direction of generalization benefits (i.e., either positive or negative values, depending on the particular parameter—i.e., for start values: “generalization,” meaning better performance at the start of the generalization block than was observed at the start of the initial block, is indicated by higher values of accuracy for the dot-motion task and lower values of threshold for the texture task). Shaded area indicates smoothed density. Lines indicate mean and bootstrapped 90% CI (i.e., reflecting one-sided tests from Results).

