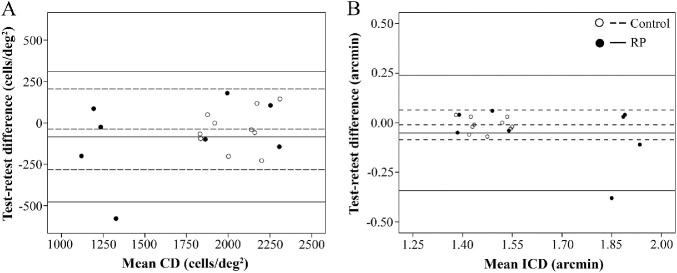
Figure 3.
Bland–Altman plots show no relationship between intra-session test–retest difference and mean CD (A) and ICD (B) in the control and patient groups. In each eye, the two highest values from the same session were analyzed. For each group, the middle, upper, and lower lines represent mean +2 SD and −2 SD of the test–retest differences.

