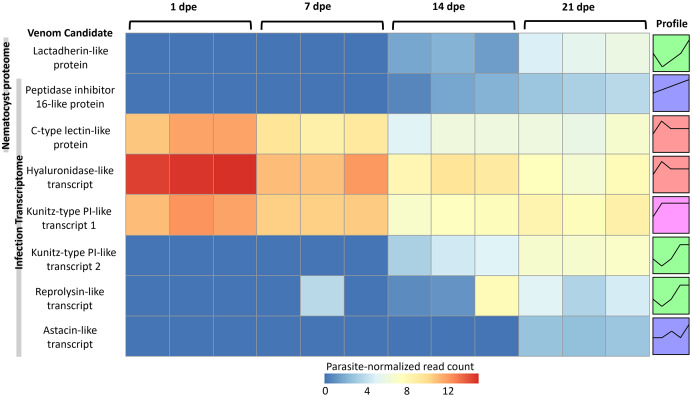
Figure 5. Heatmap of time-series expression of genes coding for the 8 VLCs, at 1, 7, 14 and 21-days post exposure (dpe).
There are three replicate fish per timepoint, each represented by a square that is shaded by gene read count, normalized for parasite replication. STEM Profiles are assigned to sequences by expression. Profiles with the same color belong to the same expression cluster.

