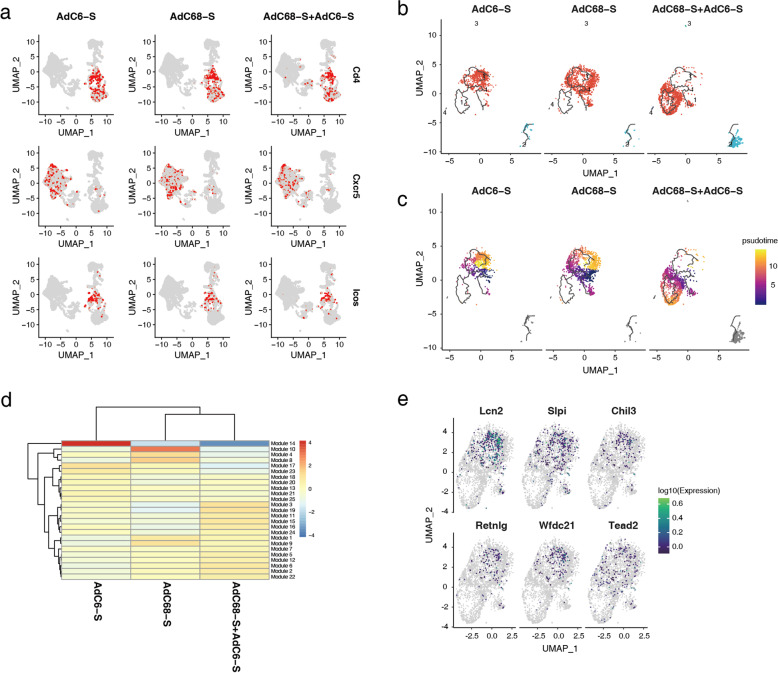
Fig. 5. Heterologous prime-boost strategy of vaccine candidates promoting differentiation of follicular B cells through scRNA-seq analysis.
a UMAP of Tfh cells in each vaccinated group, and expression levels of representative marker genes of Tfh cells are plotted. The color key from gray to red indicates relative expression levels from low to high, respectively. b Reconstruction of the developmental trajectory of follicular B cells using the Monocle 3 algorithm, and four subgroups were identified. Each cell is colored by its subgroup category and displayed on UMAP. c UMAP of single-cell pseudotime trajectory of follicular B cells; cells are ordered in pseudotime and colored in a gradient from purple to yellow. d Heatmap displaying modules of co-regulated genes in subgroup 1 for follicular B cells. e UMAP of DEGs in module 10 and module 14.

