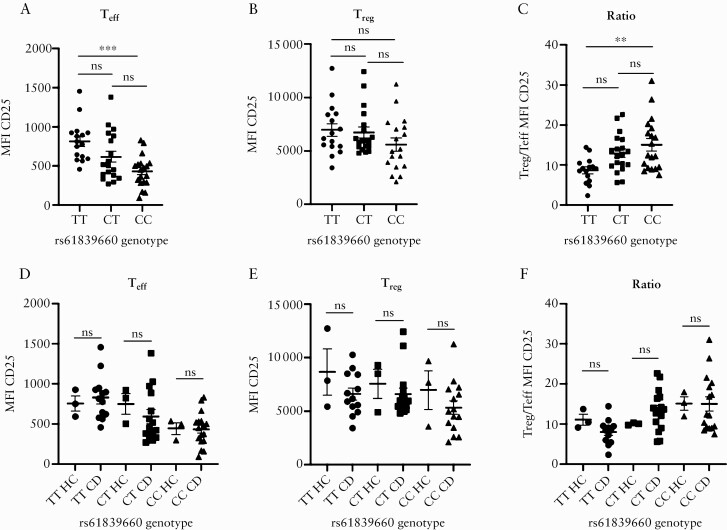
Figure 1.
rs61839660 modulates CD25 expression on effector T cells. [a] Mean fluorescence intensity [MFI] of CD25 flow cytometry staining by genotype in CD4+ effector T cells [Teff]. Teff from minor allele homozygotes [TT] demonstrated increased expression of CD25 compared with major allele homozygotes [CC] [p = 0.0002]. [b] MFI of CD25 staining by genotype in Treg. There was no difference in the MFI of CD25 by genotype in regulatory T cells [Treg]. [c] Ratio of CD25 expression in Treg/Teff. TT subjects demonstrated a reduced ratio of CD25 expression compared with CC subjects [p = 0.002]. [d] There was no difference in CD25 expression in Teff or [e] Treg or [f] in the MFI CD25 ratio Treg/Teff between CD patients and healthy controls within each genotype group. Mean ± SEM plotted. Statistical analyses performed using one-way ANOVA, Tukey post hoc test, for comparisons involving more than two groups, and unpaired t- ests for comparisons involving two groups. TT: n = 16, CT: n = 19, CC: n = 19. **p <0.01, ***p <0.001. HC, healthy control; CD, Crohn’s disease; ns, not significant; SEM, standard error of the mean; ANOVA, analysis of variance.

