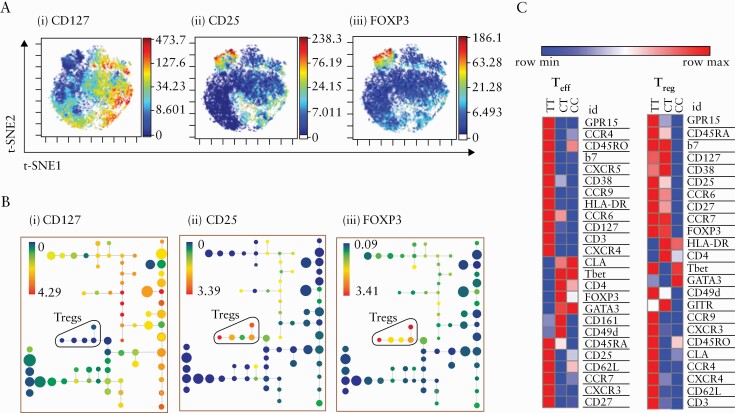
Figure 5.
CD4+ T cell effectors of minor allele homozygotes at rs61839660 demonstrate a more activated gut-homing phenotype. [a] Identifying regulatory T cells [Treg] and non-Tregs [CD4+ T effectors, Teff] using viSNE map. Cell population islands coloured by expression of [i] CD127, [ii] CD25, [iii] FOXP3. Red-blue colouring denotes highest to lowest level of expression. [b] Identifying Treg and Teff using SPADE [Spanning-tree Progression Analysis of Density-normalised Events] trees. Each node denotes a cluster. Proximity to other nodes denotes expression of similar markers. Treg populations are coloured by the expression of [i] CD127, [ii] CD25, [iii] FOXP3. Red-blue colouring denotes highest to lowest level of expression. [c] Marker Enrichment Modelling [MEM] analyses of Teff for rs61839660 minor allele homozygote [TT], heterozygote [CT], and major allele homozygote [CC] Crohn’s disease patient groups. Scaling is done per row [red = row maximum, blue = row minimum]. Higher MEM score denotes higher expression of a marker in a group, compared with another.

