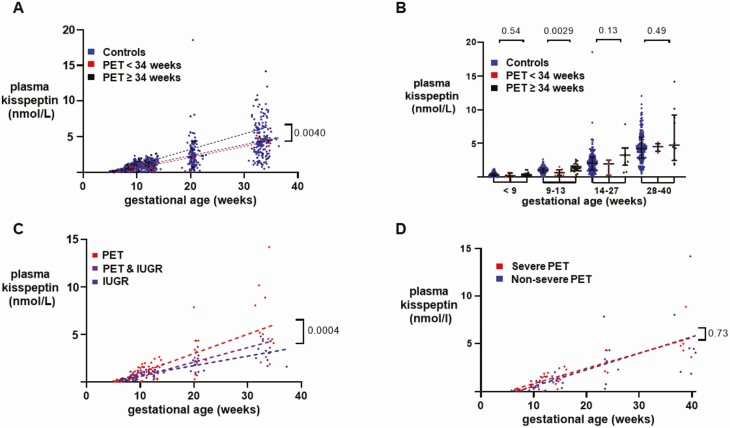
Figure 2.
Variation in plasma kisspeptin levels according to severity, onset, and complications of pre-eclampsia. A, Scatterplot of plasma kisspeptin levels in healthy controls (blue) (n = 265 women providing 898 samples), women with early-onset pre-eclampsia (PET < 34 weeks) (red) (n = 8 women providing 27 samples) and women with late-onset PET (> 34 weeks) (black) (n = 16 women providing 65 samples) over weeks of gestational age estimated by crown– rump length (CRL) throughout pregnancy. Data were analyzed by simple linear regression (r2 = 0.55 in controls, 0.87 in early PET and 0.54 in late PET); P = 0.0040 by ANCOVA. Analysis of subgroups of HDP are presented only as exploratory analyses and should be interpreted with caution as they may be subject to type 2 error. B, Medians (IQR) of plasma kisspeptin levels in healthy controls (blue) (n = 265 women providing 898 samples), women with early-onset PET (< 34 weeks) (red) (n = 8 women providing 27 samples) and women with late-onset PET (> 34 weeks) (black) (n = 16 women providing 65 samples) over the early and late first trimester, and second and third trimesters. Data were analyzed by Kruskal–Wallis test. Analysis of subgroups of HDP are presented only as exploratory analyses and should be interpreted with caution as they may be subject to type 2 error. C, Scatterplot of plasma kisspeptin levels in women with PET (red) (n = 20 women providing 82 samples), women with intrauterine growth restriction (IUGR) (blue) (n = 17 women providing 56 samples) and women with both PET and IUGR (purple) (n = 3 women providing 8 samples) over weeks of gestational age estimated by CRL throughout pregnancy. Data were analyzed by simple linear regression (r2 = 0.55 in PET, 0.69 in IUGR, and 0.92 in PET& IUGR); P = 0.0004 by ANCOVA. Analysis of subgroups of HDP are presented only as exploratory analyses and should be interpreted with caution as they may be subject to type 2 error. D, Scatterplot of plasma kisspeptin levels in women with severe PET (red) (n = 13 women providing 39 samples) and women with nonsevere PET (blue) (n = 7 women providing 38 samples) over weeks of gestational age estimated by CRL throughout pregnancy. Data were analyzed by simple linear regression (r2 = 0.76 in severe PET and 0.47 in nonsevere PET); P = 0.73 by ANCOVA. Analysis of subgroups of HDP are presented only as exploratory analyses and should be interpreted with caution as they may be subject to type 2 error.

