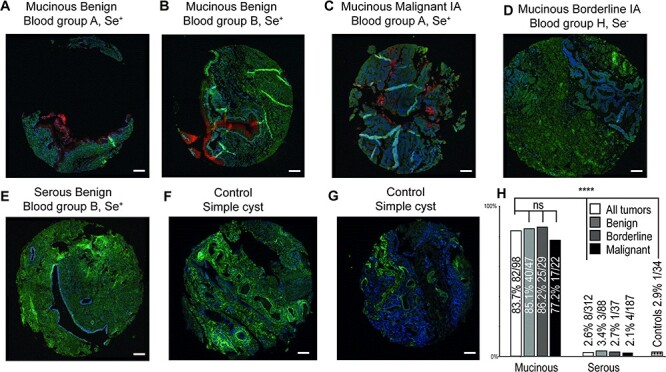
Fig. 4.

Incidence of in situ PLA-positive UEA I/MUC5AC in ovarian tumor tissue. TMA images using the UEA I/MUC5AC PLA pair on mucinous and serous tumor tissues showing positive staining of epithelial layers of mucinous cells from Se+ individuals (A, B, C), but negative staining of tumor tissue from a Se− individual diagnosed with mucinous OC (D) as well as a serous tumor tissue from a Se+ individual (E). (F) and (G) shows the negative staining of ovarian tissue from two control individuals diagnosed with benign noncancerous simple cysts. The bar graph (H) shows the incidence of positive staining of TMA from 410 patients diagnosed with mucinous (n = 98), serous ovarian (n = 312) tumors and benign noncancerous cyst tissue (34). Percentage and number of positive of the total (in brackets) is displayed over each bar divided up into all stages and subdivided into benign, borderline type and malignant. Contingency was calculated using Fisher’s exact test, where P > 0.05 was considered as not significant (ns). **** means P < 0.0001 significance comparing staining incidence both between mucinous and serous cancer and mucinous cancer against controls. Hematoxylin and eosin staining of the cancer samples are available in Supplementary Figure S1. Inserted white scale bars represent 100 μm.
