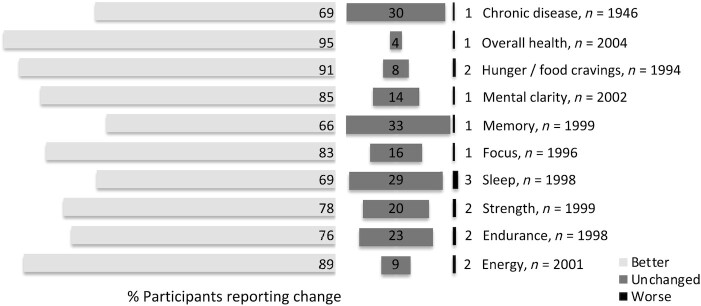
FIGURE 1.
Reported changes in health status. Participants were asked to rate their current overall health and well-being on a 3-point scale as better (light gray bars), unchanged (dark gray), or worse (black) compared with the time before starting the carnivore diet. Percentage of respondents is given.

