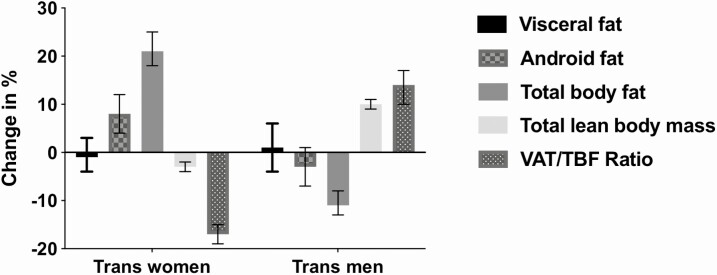
Figure 1.
Relative changes in measures of body fat distribution and body composition during 1 year of hormone therapy in 179 trans women and 162 trans men. Trans women: visceral adipose tissue: −1% (95% CI −4, 3); total body fat 21% (95% CI 18, 25); VAT/TBF: −17% (95% CI −19, −15); and lean body mass: −3% (95% CI −4, −2). Trans men: visceral adipose tissue: 1% (95% CI −4, 6); total body fat: −11% (95% CI −13, −8); VAT/TBF: 14% (95% CI 10, 17); and lean body mass 10% (95% CI 9, 11). Abbreviation: VAT/TBF, visceral adipose tissue/total body fat ratio.

