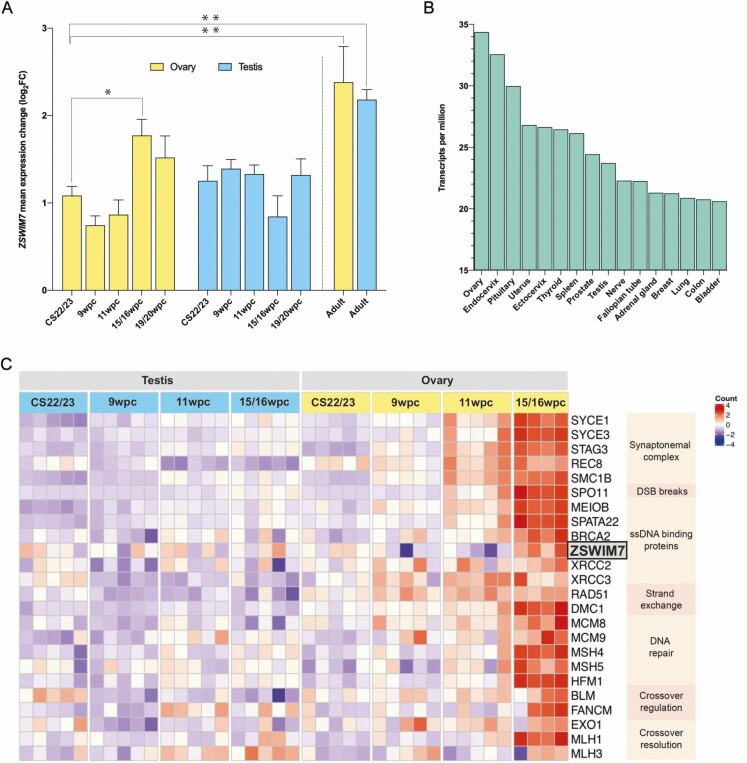
Figure 2.
(A) qRT-PCR mean expression (log2) of ZSWIM7 in various tissues compared with reference (GAPDH) and relative to the expression of ZSWIM7 in a Carnegie Stage (CS) 22-ovary sample. Four fetal ovary and fetal testis tissue samples were included at each of the following stages: CS22/CS23, 9 wpc, 11wpc, 15 to 16 wpc, and 19 to 20 wpc. Bar heights indicate mean expression. Error bars indicate mean ± SEM. Independent samples t tests and 1-way ANOVA testing were used to assess differences in ZSWIM7 mean expression change between tissue stages (*P < 0.05; **P < 0.01). There was significantly higher ZSWIM7 expression in the 15 to 16 wpc ovary compared with the 15 to 16 wpc testis (P = 0.02). There was significantly higher ZSWIM7 expression in the adult ovary compared with the CS22/23 ovary (P = 0.004) and in the adult testes compared with the CS22/23 testes (P = 0.003) compared with the CS22/23 testes. (B) ZSWIM7 expression across adult tissues from the GTEx database (v8). Data are expressed in transcripts per million. (C) Heatmap representing differential gene expression of key meiotic genes during prophase I across 4 developmental timepoints (CS22/23, 9 wpc, 11 wpc, 15-16 wpc). The intensity of gene expression is indicated by a color scale: violet for lowest expression and red for highest expression. ZSWIM7 is highlighted in gray. GAPDH, glyceraldehyde 3-phophate dehydrogenase; qRT-PCR, quantitative reverse transcriptase PCR; wpc, weeks postconception.

