Figure 1.

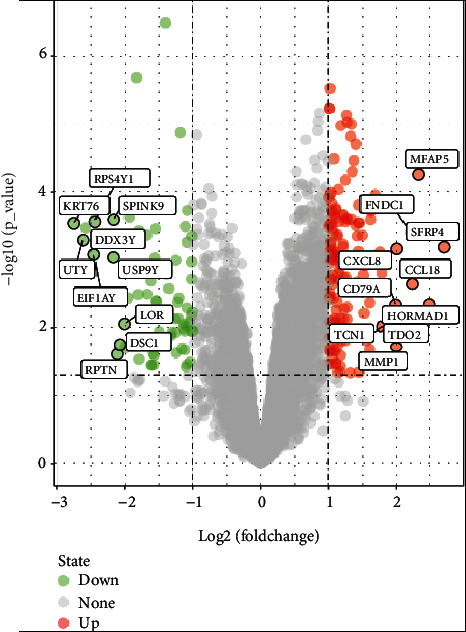
Volcano maps of differentially expressed genes. Red and green spots represent differentially expressed genes: red spots represent upregulated genes and green spots represent downregulated genes.

Volcano maps of differentially expressed genes. Red and green spots represent differentially expressed genes: red spots represent upregulated genes and green spots represent downregulated genes.