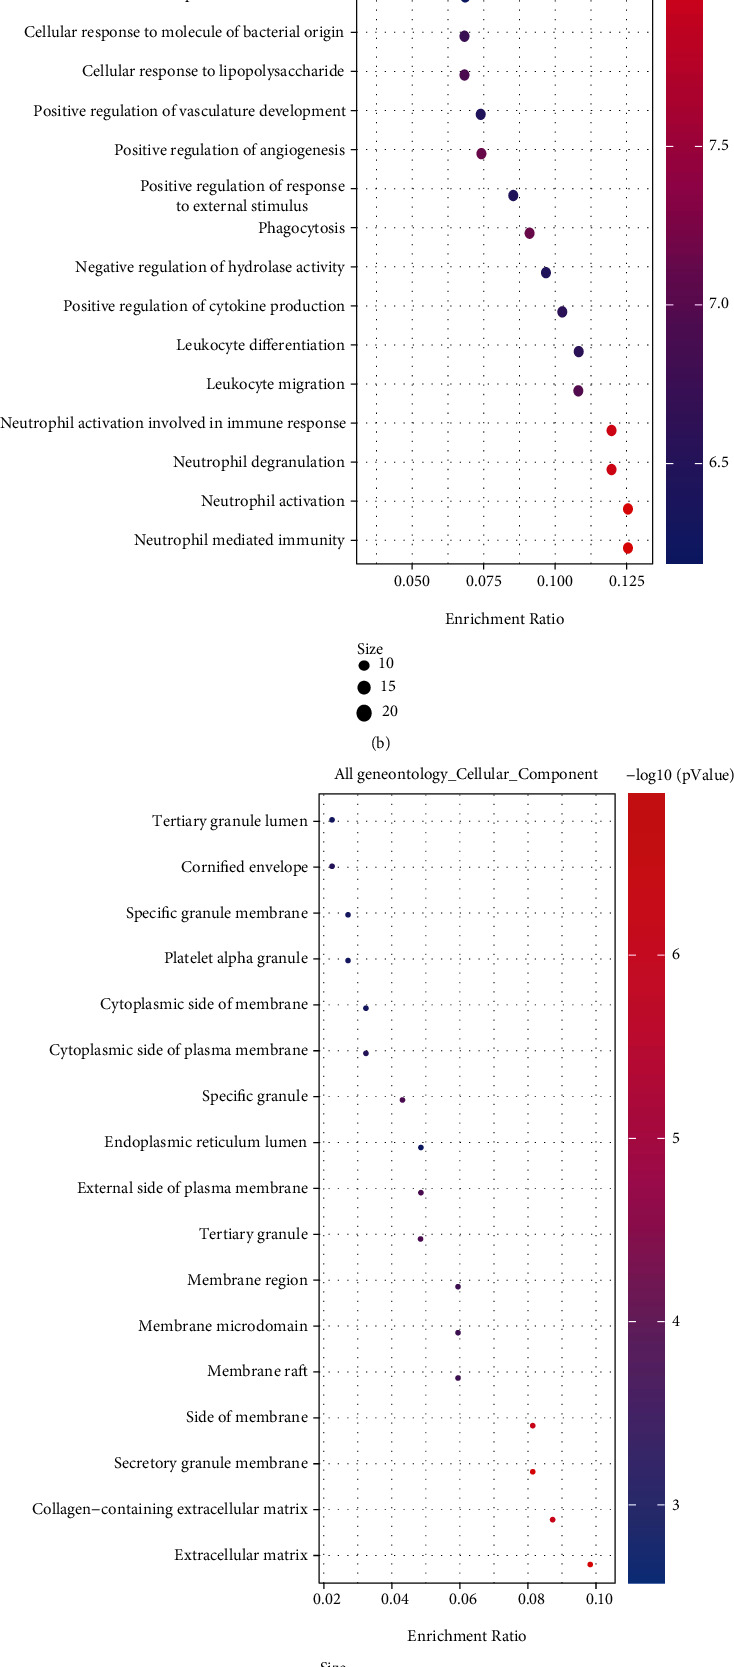
Figure 2.

Results of GO and KEGG analysis results of differentially expressed genes: (a) KEGG pathway enrichment results; (b) GO biological process enrichment results; (c) GO cell component enrichment results; (d) GO molecular function enrichment results. The x-axis represents gene ratio, and the y-axis represents GO terms. The size of each circle indicates gene count. The color of circles represents different -log10(P.values).
