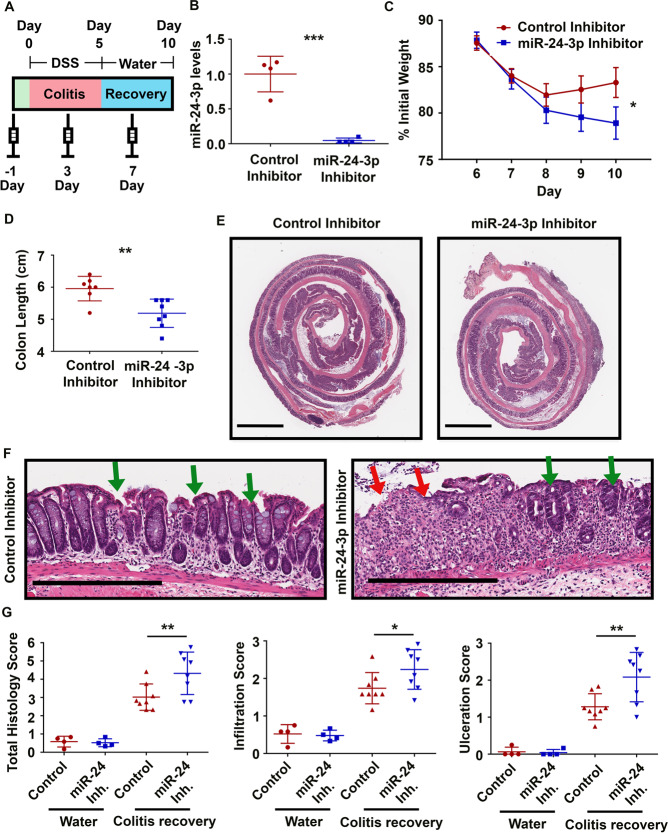
Fig. 3. Inhibition of miR-24-3p diminishes mucosal repair after colitis.
A A schematic describing the time course for inhibitor injections as it pertains to the colitis recovery experiments. B After colitis and recovery, the level of miR-24-3p in the distal colon was measured by RT-qPCR. n = 4 mice/group. Mean ± SD. C A graph of percent weight change over the course of recovery after colitis. n = 24 mice/group from three independent experiments. Mean ± SEM. Three independent experiments. D On day 10 of the protocol, mice were euthanized, and colon lengths were measured from the rectum to the cecum. n = 8 mice per from three independent experiments. Mean ± SD. E Representative H&E-stained Swiss-rolls used for histology scoring. Scale bars = 2 mm. F Magnified images of the central colons from control inhibitor or miR-24-3p inhibitor-treated mice. The green arrows indicate areas of re-epithelization and red arrows indicate areas of immune cell infiltration and epithelial ulceration. Scale bars = 0.4 mm. G Representative graphs of double-blind histology scores. n = 8 mice per group for water treated, n = 16 mice per group for DSS treated from two independent experiments. Mean ± SD. *p < 0.05; **p < 0.01; ***p < 0.001.

