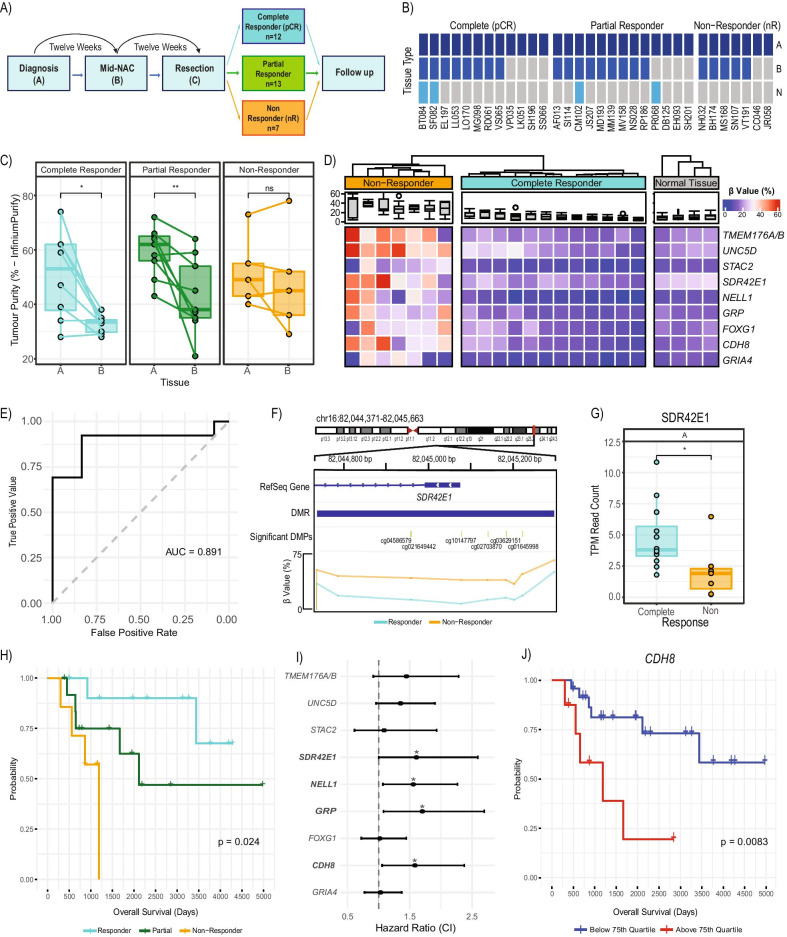
Fig. 1.
DNA methylation associated with response to NAC and patient survival in the SETUP study. A Overview of biopsy sample collection in the SETUP study. B Sample availability per patient at diagnosis and mid-NAC for DNA methylation profiling. C Boxplot of tumour purity estimated from DNA methylation in paired samples between biopsies A and B, shows that after 12 weeks of treatment complete and partial responders show an average 18% (P = 0.012) and 19.4% (P = 0.0084) reduction in tumour purity respectively. D Dendrogram and heatmap of the 9 significant response-DMRs (∆β > 10%, FDR < 0.1) found when comparing complete responders (n = 12) against non-responders (n = 7), with normal breast methylation data shown for reference (n = 4). E Receiver operating characteristic (ROC) curve showing the ability of the 9 response-DMRs to distinguish complete (n = 12) from partial responders (n = 13) on all diagnostic samples (biopsy A, AUC = 0.891). F Schematic of the SDR42E1 gene promoter showing location of the response-DMR, individually significant probes and β values averaged within response group (pCR n = 12 and nR n = 7). G Boxplot showing significant differential expression of response-DMR SDR42E1 (biopsy A, Welch t-test, P < 0.05). Survival analysis on all 9 response-DMRs was undertaken on the entire SETUP cohort at diagnosis (n = 32). H Kaplan Meier plot of overall survival stratified by patient response (Log-rank test, P = 0.024). I Forest plot showing the Cox hazard ratios (± 95% CI) for overall survival for each response-DMRs. J Kaplan Meier plot of overall survival for patients in the highest quartile of methylation for response-DMR CDH8 (top 25%, red) versus the rest of the cohort (bottom 75%, blue), (HR = 1.58 (CI: 1.06, 2.38), Log-rank test, P = 0.0083)

