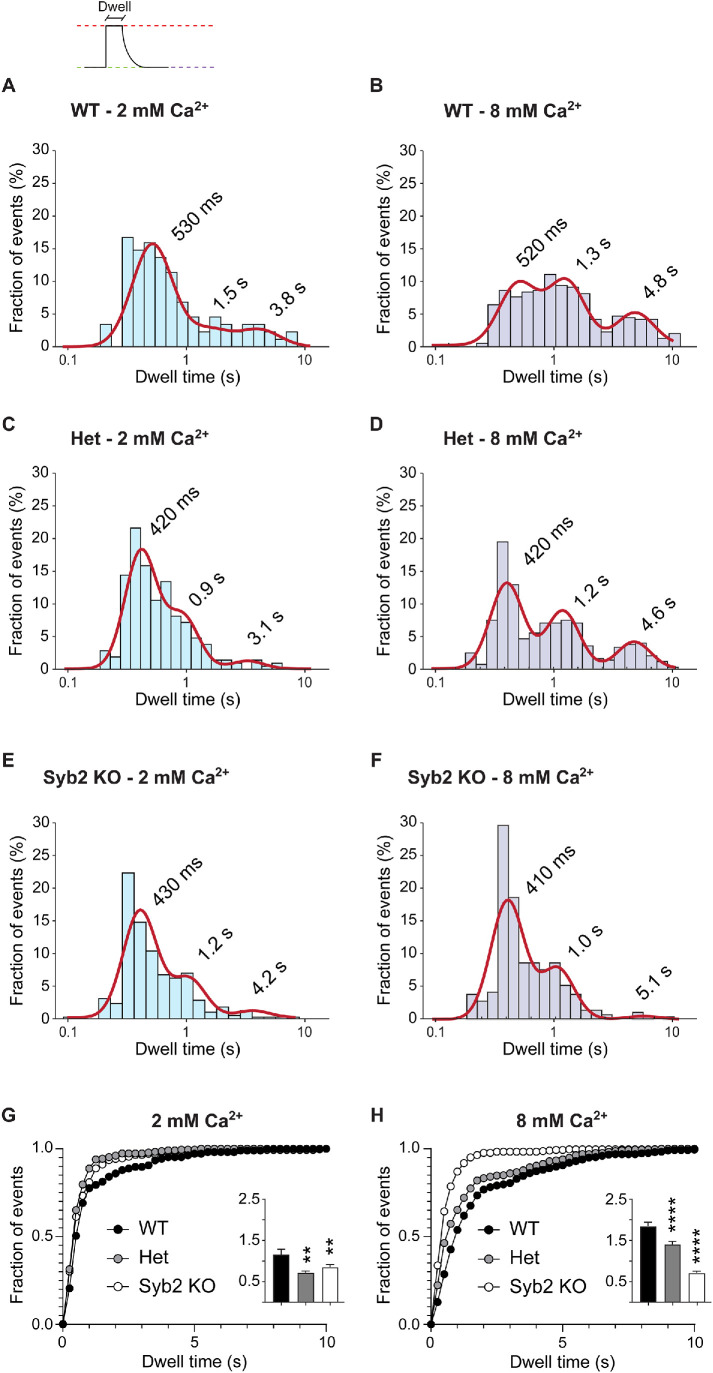
FIGURE 3:
Deleting syb2 accelerates vGluT1-pHluorin endocytosis after single synaptic fusion. (A–F) Probability distribution of single vesicle dwell times (bars) and Gaussian mix model fit (straight red lines). (G, H) Cumulative distribution of dwell times comparing the different genotypes. Insets: Average dwell time for each experimental group. Kruskall-Wallis test: p < 0.0001. Dunn’s multiple comparison’s test for 2 mM Ca2+: WT vs. Het, p = 0.0012; WT vs. syb2 KO, p = 0.0046. Dunn’s multiple comparison’s test for 8 mM Ca2+: WT vs. Het, p < 0.0001; WT vs. syb2 KO, p < 0.0001. WT 2 mM Ca2+ vs. WT 8 mM Ca2+, p = 0.0002.

