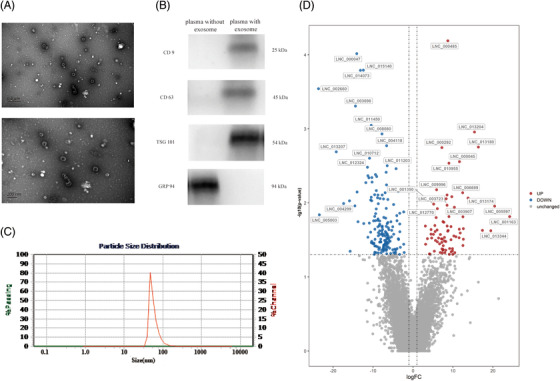
FIGURE 1.

Identification of exosome and visualization of differentially expressed exosomal lncRNAs. (A) Exosomes were observed as elliptical concave shaped vesicles by TEM (up: Figure scale bar = 0.5μm; down: Figure scale bar = 200 nm). (B) CD9 (25 kDa) and TSG101 (54 kDa), CD63 (45 kDa) and GRP 94 (94 kDa) were analyzed by Western blotting. Lane left: plasma without exosome; lane right: plasma with exosome. (C) NTA revealed the sizes of exosomes were ranged from 30–150 nm in diameter (accounted for 95.42% of all particles). (D) Volcano plots of differential exosomal lncRNAs in LAA stroke. The figure shows 30 exosomal lncRNAs with the most significant differential expression (|log2fold change| ≥2, and P value < 0.05).
