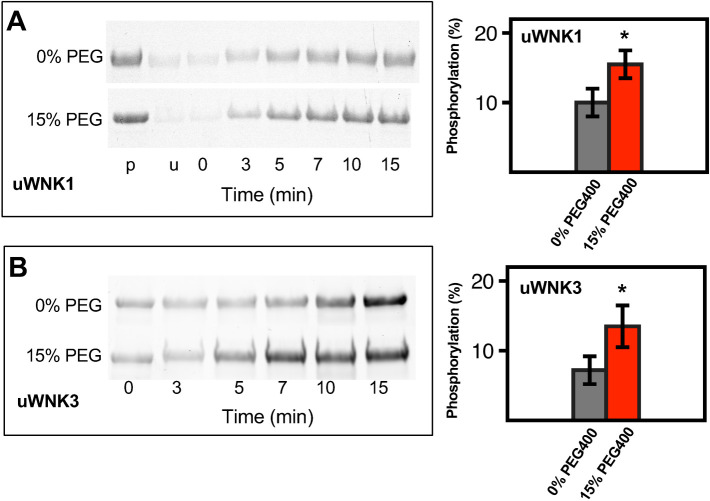
FIGURE 2:
Effects of PEG400 on uWNK1 and uWNK3 autophosphorylation and substrate phosphorylation. (A) Time-course of uWNK1 autophosphorylation with and without PEG400 visualized by Pro-Q Diamond phospho-protein stain at indicated times. Densitometry of triplicated gels shown in associated bar graph. *p < 0.1 (right). (B) Time-course of uWNK3 autophosphorylation with and without PEG400.

