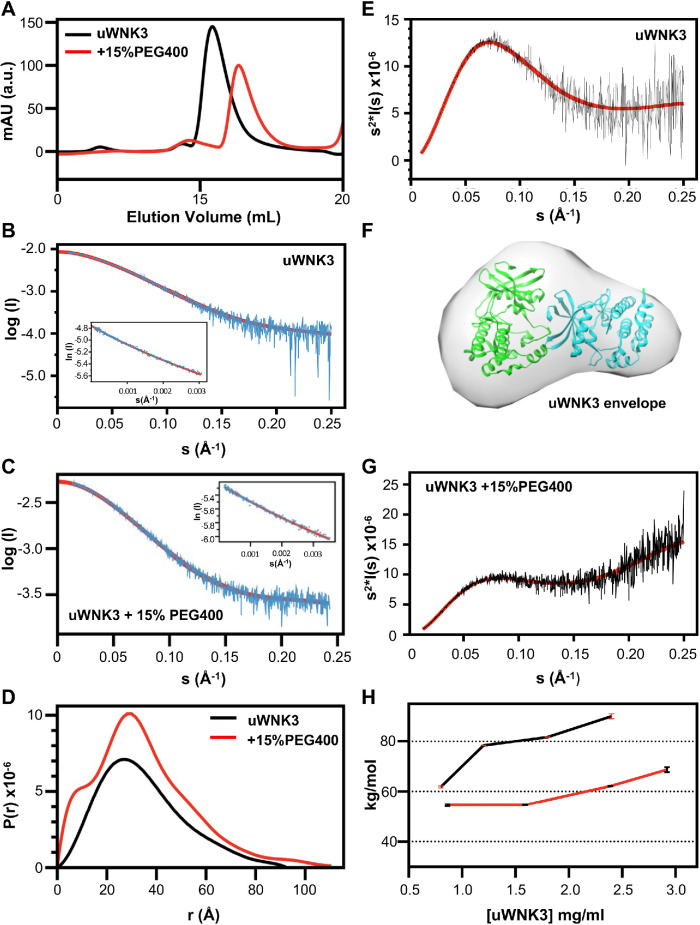
FIGURE 3:
Size and shape of uWNK3 ∓ 15% PEG400 from SEC-SAXS and SLS. (A) uWNK3 SEC elution profile (no PEG, black, 15% PEG400, red). uWNK3 scattering profile vs. s and Guinier plot (insert), (B) without PEG400, and (C) with PEG400. Scattering data are cyan, best fit from PRIMUS is red and shown extrapolated to I(0). The scattering curve was truncated at s = 0.25 Å–1. Fit to the Guinier approximation (red). (D) Pairwise distance distribution functions for uWNK3 (black) and uWNK3 with 15% PEG400 (red). (E) Kratky plot (I(s)*s2 vs. s) for uWNK3 (black) with averaged plot (red). (F) Envelope for uWNK3 (generated in DAMMIF) superimposed in CHIMERA on PDB file 6CN9 (dimeric WNK1). (G) Kratky plot uWNK3 in 15% PEG400. (H) SLS of uWNK3 (black) and uWNK3 in 10% EG (red).

