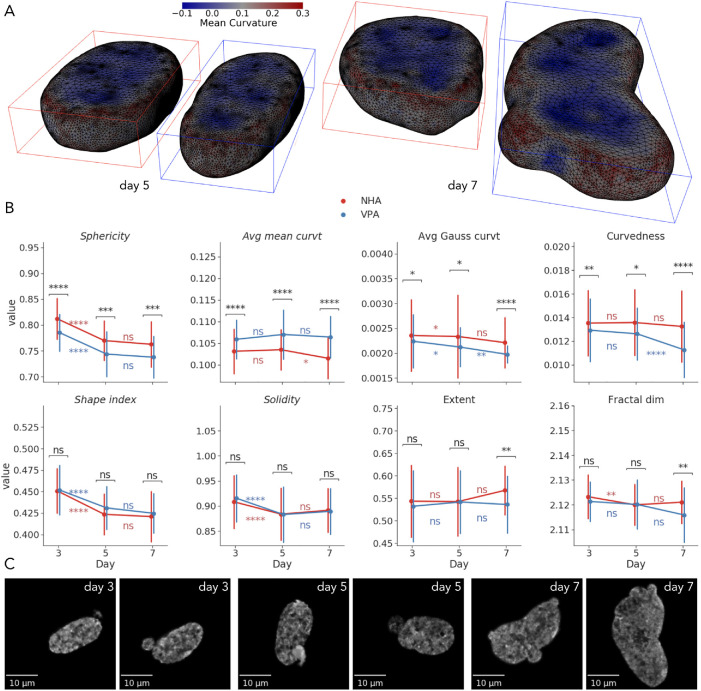
FIGURE 4:
Visualization and univariate statistical analysis of shape changes under VPA treatment. (A) Reconstructed surfaces of a representative NHA and VPA nuclei on days 5 and 7, annotated with per-vertex mean curvature. (B) Time-dependent changes in morphometric measures of nuclear shapes (points show mean; error bars show SD; *, p < 0.05; **, p < 0.01; ***, p < 0.001; ****, p < 0.0001). (C) XY maximum intensity projections of VPA-treated nuclei with irregular shapes and blebbing.

