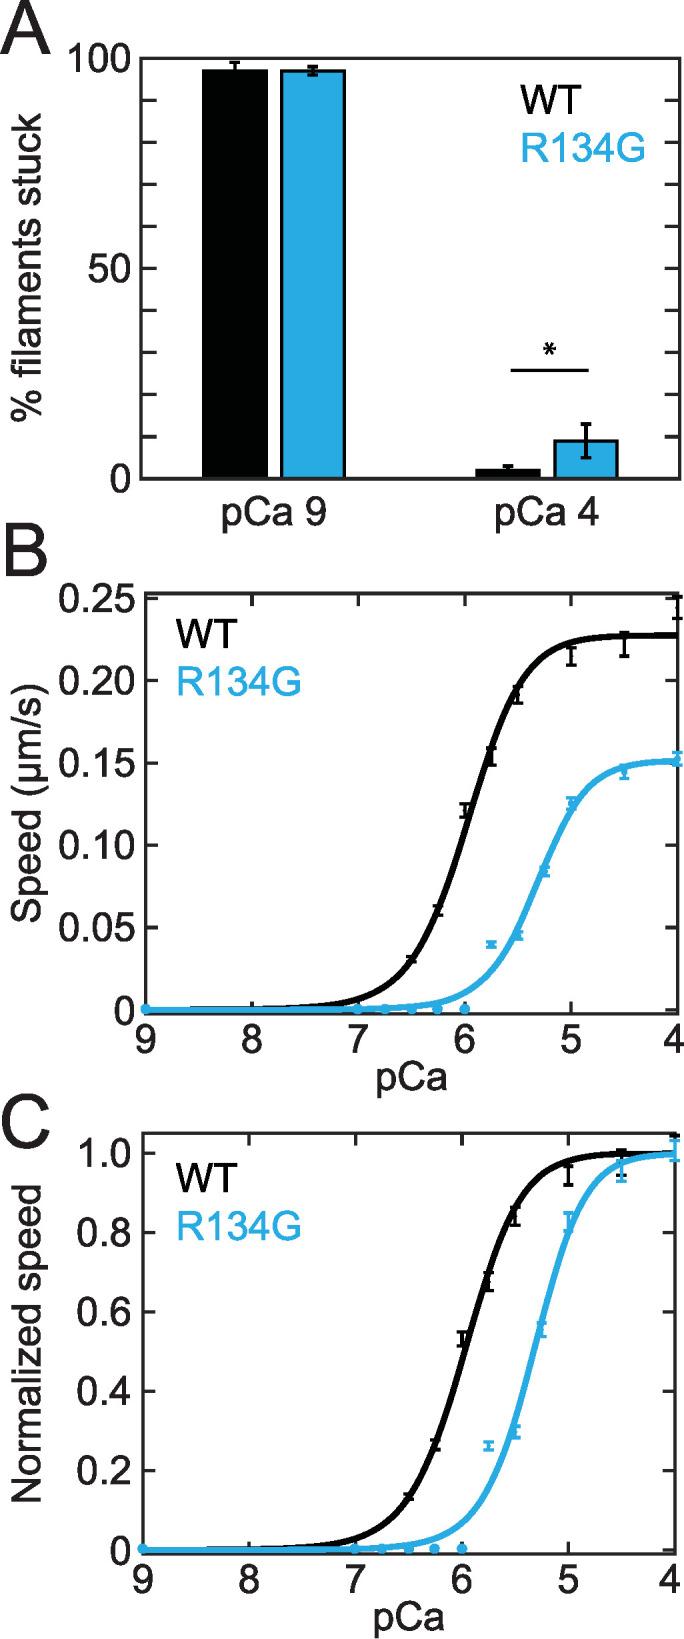
FIGURE 2:

(A) Percent stuck filaments in an in vitro motility assay at pCa 9 (97 ± 2% for WT, 97 ± 1% for R134G; p = 0.91) and pCa 4 (2 ± 1% for WT, 9 ± 4% for R134G; p = 0.003). Asterisk indicates a statistically significant difference in the percent stuck filaments at pCa 4. Raw (B) and normalized (C) RTF gliding speed as a function of calcium concentration in the in vitro motility assay. Curves are fits to a Hill equation. Error bars represent SEM of 150 tracked RTFs from three independent experimental days. R134G (Vmax = 0.15 ± 0.1 μm/s) results in a decrease in the maximum gliding speed relative to WT (Vmax = 0.23 ± 0.1 μm/s; p < 0.001). Normalized RTF gliding speed is shown to more clearly illustrate the decrease in calcium sensitivity caused by the R134G variant (pCa50 [R134G] = 5.3 ± 0.1, pCa50 [WT] = 6.0 ± 0.1; p < 0.001). Note that data collected at pCa 6.75, 7, 8, and 9 are obscured by the fit line.
