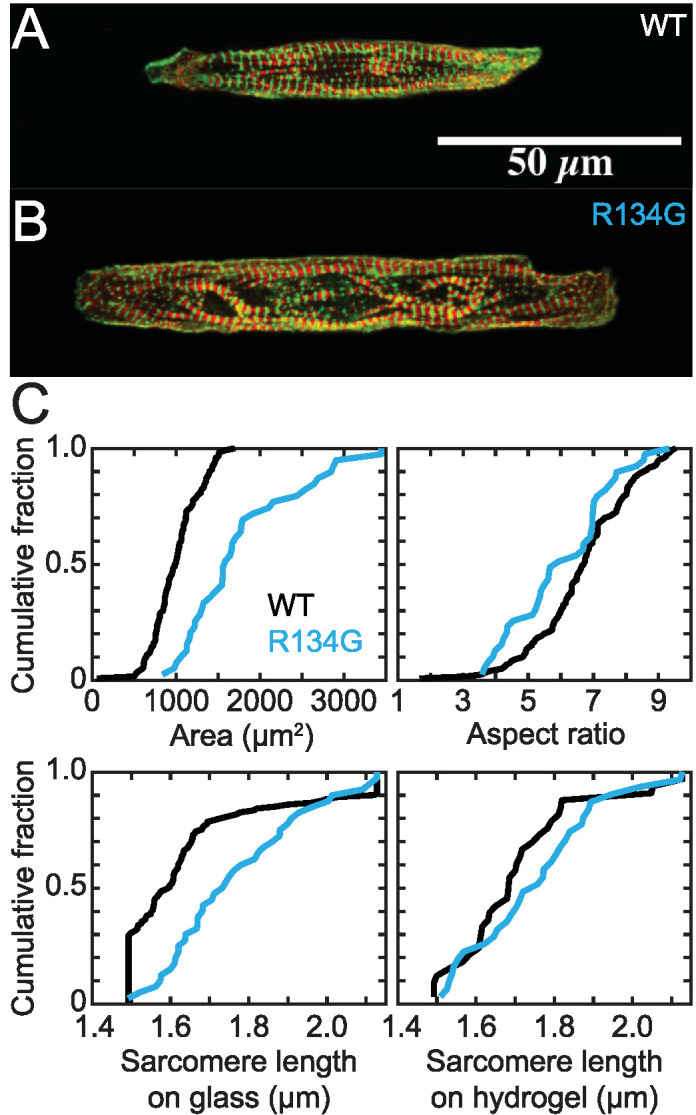
FIGURE 6:

Representative immunofluorescence images of sarcomeres in hiPSC-CMs on a rectangular pattern on glass. Troponin I is red, and α-actinin is green. Images are z-projections. (A) WT hiPSC-CM. (B) R134G hiPSC-CM. R134G hiPSC-CMs exhibit sarcomeric disorganization and increased cell area. (C) Quantification of areas, aspect ratios, and sarcomere lengths from immunofluorescence images of WT (n = 120) and R134G (n = 39) hiPSC-CMs on glass and sarcomere lengths of WT (n = 33) and R134G (n = 31) hiPSC-CMs on hydrogel. Data are plotted as cumulative distributions, and parameter values are given in Table 1. R134G hiPSC-CMs had a larger cell area (p = 0.002) and a smaller aspect ratio (p = 0.028) than WT hiPSC-CMs. R134G hiPSC-CMs had longer sarcomere lengths than WT hiPSC-CMs on glass (p = 0.004) but not on hydrogel (p = 0.342).
