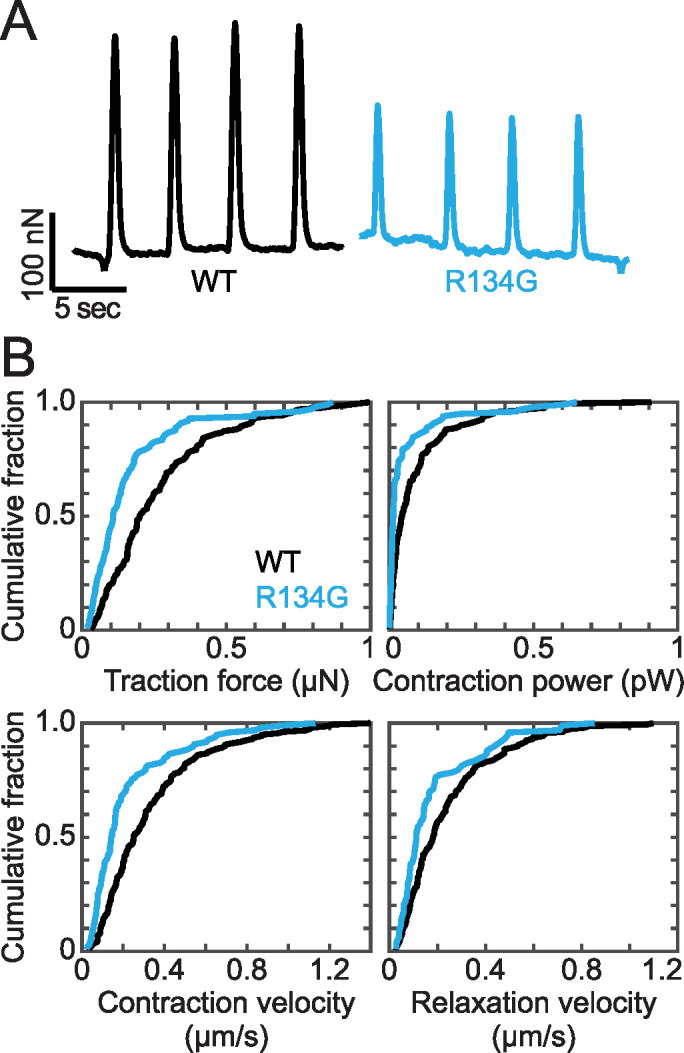
FIGURE 7:

(A) Representative force transients of beating hiPSC-CMs measured using traction force microscopy. R134G hiPSC-CMs show reduced contractility compared with WT. (B) Quantification of force, power, and contraction and relaxation velocities measured using traction force microscopy. Data are plotted as cumulative distributions, and parameter values are given in Table 1. R134G (n = 97 cells) decreased the traction force (p = 0.002), power (p = 0.018), and contraction (p = 0.006) and relaxation (p = 0.012) velocities relative to WT (n = 158 cells).
