
FIGURE 8:
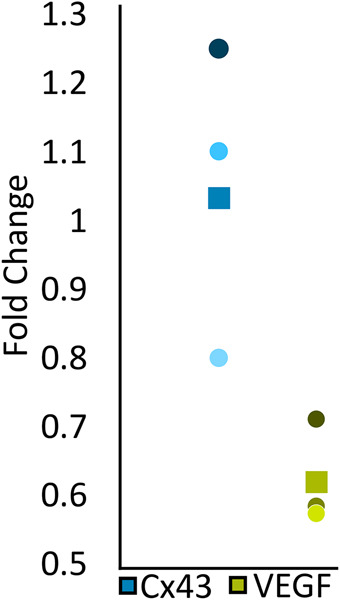
cx43lh10 fish exhibit down-regulated vegf gene expression. Fifteen 2 dpf WT and cx43lh10 zf embryos each were pooled, total mRNA prepared and retranscribed and mRNA levels of cx43 and vegf quantitatively amplified by qRT-PCR using specific primer pairs. Expression fold changes of three independent biological replicates were quantified (cx43, blue; and vegf, green). The box in the plot indicates the average fold change, and circles represent the fold change of each replicate. Note unchanged cx43 mRNA expression in cx43lh10 compared with WT fish, while vegf mRNA expression is reduced significantly.