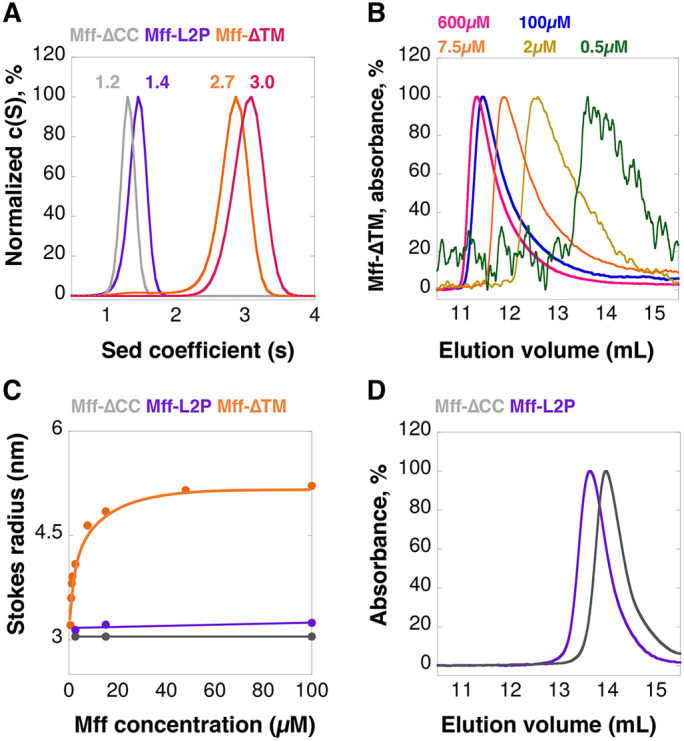
FIGURE 2:

Mff undergoes reversible oligomerization, dependent on the CC region. (A) vAUC of Mff-∆TM at 100 µM (orange) or 250 µM (pink), and Mff-∆CC (gray) or Mff-L2P (purple) at 100 µM. The y-axis normalized to the peak c(S) for each sample; the maximum value of each curve is normalized as 100%, as for panels B–D. Peak sedimentation coefficients are listed on the graph. (B) SEC profiles for multiple concentrations of Mff-∆TM detected at 280 nm. The sample at 0.5 µM has low absorbance and thus gives a noisy trace. (C) Graph of calculated Stokes radius (from SEC results) versus Mff concentration for Mff-∆TM, Mff-∆CC, and Mff-L2P. (D) SEC for Mff-∆CC and Mff-L2P at 100 µM.
