FIGURE 2:
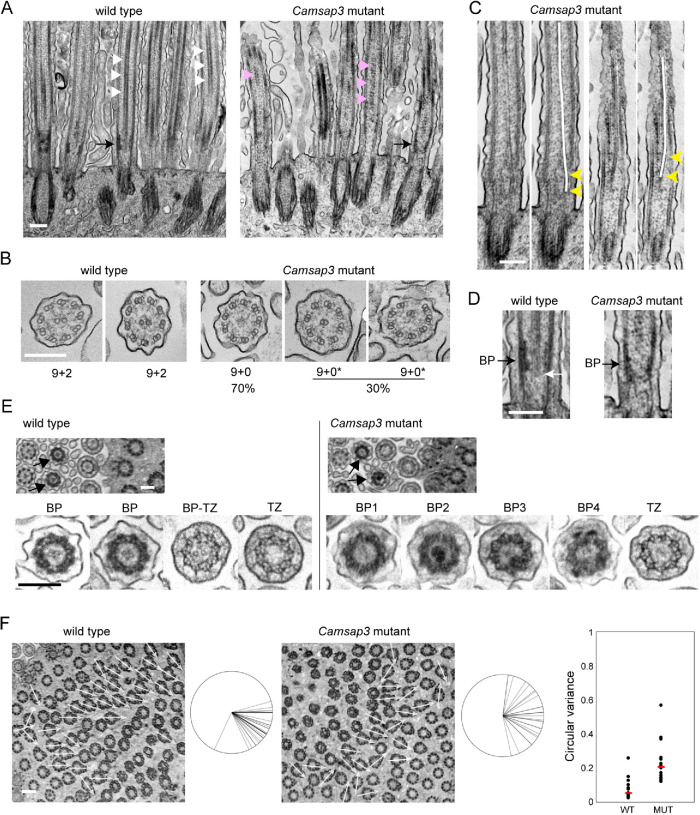
TEM analysis of cilia and basal bodies. (A) Longitudinal section of a multiciliated cell, which yields a longitudinal view of axonemes and basal bodies. White triangles indicate examples of the CP in a wild-type cell; magenta triangles point to intermittent structures at the central position of axoneme in a Camsap3-mutated cell. Black arrows point to the “basal plate” and a corresponding position in the Camsap3 mutant sample. A representative image of more than 50 sections is shown for each genotype. (B) Transverse section of cilia. In the mutant samples, 218 cilia from two independent sections were used for analysis. The mutant axonemes did not contain a CP; instead, some of them (marked as 9+0*) had a doublet microtubule that was mislocalized to central or semicentral positions. (C) Longitudinal section of cilia in Camsap3-mutated cells. A centrally located microtubule structure tilts toward the peripheral zone at basal portions of axoneme, as indicated by yellow arrowheads. Two examples are shown, each of which is duplicated to trace the central microtubule with a white line over the image. (D) Part of the image in A is enlarged. The white arrow points to the proximal end of the CP. BP, BP. (E) Slightly oblique, transverse sections of a multiciliated cell showing cross-sectional views of axoneme and BB at various longitudinal levels, in which arrows point to BPs that are characterized by a dense peripheral ring. Typical examples of ciliary sections at the level of BP and TZ are enlarged at the bottom. The image labeled BP-TZ likely represents a section at the boundary between BP and TZ. In the mutant sections, all of the BPs show some abnormality, including loss or overcondensation of the central structure, and partial deformation of the peripheral ring. Typical examples are shown. More than 20 sections, each of which contains more than 50 cilia, were examined for each genotype. (F) Slightly oblique, transverse section of a multiciliated cell, focusing on the basal foot of basal bodies. The direction of individual basal feet is shown with white arrows on the image, and these are aggregated at the right of each image. The range of orientation of basal feet on the cell varied from 26° to 108° in the wild type, with one exceptional case, and 13° to 172° in the mutant sample. We counted 33 and 26 basal bodies for the wild-type and mutant samples, respectively. The graph shows the variation in basal foot polarity in 13 wild-type or 14 mutant cells, which was quantified using circular variance (CV) that was defined previously (Shi et al., 2014), where cells with lower CV represent uniform BB orientation. Red bar, median. WT, wild type; MUT, Camsap3 mutant. Age of mice used, P126. Thickness of sections, 50 to 70 nm. Scale bars, 200 nm in A–E; 400 nm in F.

